<?xml version="1.0" encoding="utf-8"?><feed xmlns="http://www.w3.org/2005/Atom" ><generator uri="https://jekyllrb.com/" version="3.10.0">Jekyll</generator><link href="https://danielhomola.com/feed.xml" rel="self" type="application/atom+xml" /><link href="https://danielhomola.com/" rel="alternate" type="text/html" /><updated>2026-03-24T08:37:40+01:00</updated><id>https://danielhomola.com/feed.xml</id><title type="html">Daniel Homola</title><subtitle>Personal website of Daniel Homola full-stack ML engineer &amp; founder. </subtitle><author><name>Approaching 50%</name></author><entry><title type="html">Your bridge to wealth is being pulled up - short version</title><link href="https://danielhomola.com/m%20&%20e/ai/your-bridge-to-wealth-is-being-pulled-up-tldr/" rel="alternate" type="text/html" title="Your bridge to wealth is being pulled up - short version" /><published>2026-03-21T00:00:00+01:00</published><updated>2026-03-21T00:00:00+01:00</updated><id>https://danielhomola.com/m%20&amp;%20e/ai/your-bridge-to-wealth-is-being-pulled-up-tldr</id><content type="html" xml:base="https://danielhomola.com/m%20&amp;%20e/ai/your-bridge-to-wealth-is-being-pulled-up-tldr/"><![CDATA[<style>
/* ── scoped overrides inside MM's .page__content ─────────── */

.page__content p {
  font-size: 1.05rem;
  line-height: 1.82;
  margin-bottom: 1.4em;
}

/* Drop cap */
.page__content .dropcap::first-letter {
  float: left;
  font-size: 4em;
  line-height: 0.75;
  font-weight: 700;
  padding-right: 0.07em;
  padding-top: 0.04em;
  color: #1a1d1e;
}

/* Section markers */
.page__content .section-marker {
  font-size: 0.72rem;
  font-weight: 700;
  text-transform: uppercase;
  letter-spacing: 0.18em;
  color: #6f777d;
  margin: 2.8rem 0 0;
  display: block;
}

/* Override MM blockquote */
.page__content blockquote {
  border-left: 4px solid #dee1e4;
  padding: 0 1.4em;
  margin: 1.8em 0;
  font-style: italic;
  font-size: 1.1rem;
  color: #6f777d;
  line-height: 1.7;
  background: none;
}
.page__content blockquote p {
  margin: 0;
  font-size: inherit;
  color: inherit;
}

/* Notice-style aside */
.page__content .aside {
  background: #f8f9fa;
  border: 1px solid #dee1e4;
  border-left: 4px solid #c5cdd4;
  border-radius: 3px;
  padding: 0.9rem 1.1rem;
  margin: 1.8em 0;
  font-size: 0.9rem;
  color: #6f777d;
  line-height: 1.65;
}
.page__content .aside strong {
  display: block;
  font-size: 0.7rem;
  text-transform: uppercase;
  letter-spacing: 0.1em;
  color: #3d4144;
  margin-bottom: 0.3em;
  font-style: normal;
}

/* Ornamental separator */
.page__content .ornament {
  text-align: center;
  color: #dee1e4;
  font-size: 1rem;
  letter-spacing: 0.5em;
  margin: 2.5rem 0;
}

/* ── visualisation widgets ─── */
:root {
  --viz-accent: #7a3218;
  --viz-border: #dee1e4;
  --viz-bg:     #fafafa;
}

.viz-widget {
  background: var(--viz-bg);
  border: 1px solid var(--viz-border);
  border-radius: 4px;
  padding: 1.2rem 1.2rem 0.9rem;
  margin: 2rem 0;
  overflow: hidden;
}
.viz-header { margin-bottom: 0.7rem; }
.viz-tag {
  font-size: 0.68rem;
  font-weight: 700;
  text-transform: uppercase;
  letter-spacing: 0.18em;
  color: var(--viz-accent);
  display: block;
  margin-bottom: 0.15rem;
}
.viz-title-text {
  font-size: 0.95rem;
  font-weight: 700;
  color: #1a1d1e;
}
.viz-svg { width: 100%; display: block; overflow: visible; }
.viz-controls {
  display: flex;
  flex-wrap: wrap;
  gap: 0.6rem 1.4rem;
  align-items: center;
  margin-top: 0.7rem;
  font-size: 0.82rem;
  color: #6f777d;
}
.viz-control-group { display: flex; align-items: center; gap: 0.45rem; }
.viz-control-group label { white-space: nowrap; }
.viz-control-group > span {
  font-style: italic;
  color: var(--viz-accent);
  min-width: 36px;
  font-weight: 700;
}
input[type="range"] {
  -webkit-appearance: none;
  height: 3px;
  background: #dee1e4;
  border-radius: 3px;
  width: 110px;
  cursor: pointer;
}
input[type="range"]::-webkit-slider-thumb {
  -webkit-appearance: none;
  width: 14px; height: 14px;
  background: var(--viz-accent);
  border-radius: 50%;
  cursor: pointer;
  border: 2px solid #fff;
  box-shadow: 0 0 0 1px var(--viz-accent);
}
.viz-caption {
  font-size: 0.8rem;
  color: #6f777d;
  line-height: 1.55;
  font-style: italic;
  margin-top: 0.7rem;
  padding-top: 0.65rem;
  border-top: 1px solid var(--viz-border);
}

.viz-tooltip {
  position: fixed;
  background: #1a1d1e;
  color: #fff;
  font-size: 0.78rem;
  padding: 0.4rem 0.7rem;
  border-radius: 3px;
  pointer-events: none;
  opacity: 0;
  transition: opacity 0.12s;
  z-index: 9999;
  max-width: 240px;
  line-height: 1.5;
}

/* CTA block */
.tldr-cta {
  margin: 3rem 0 2rem;
  padding: 1.4rem 1.8rem;
  background: #1a1d1e;
  color: #f7f6f4;
  border-radius: 3px;
  text-align: center;
}
.tldr-cta a {
  color: #f7f6f4;
  font-weight: 700;
  text-decoration: underline;
  text-underline-offset: 3px;
}
.tldr-cta .tldr-cta-label {
  font-size: 0.65rem;
  font-weight: 700;
  text-transform: uppercase;
  letter-spacing: 0.15em;
  color: #8b8f92;
  margin-bottom: 0.5rem;
}

@media (max-width: 600px) {
  .page__content p { font-size: 1rem; }
}
</style>

<!-- ═══════════════════════════════════════════════════════════
     TLDR BODY
     ═══════════════════════════════════════════════════════════ -->
<div class="notice--primary">
  This post is part of my <a href="/m%20&%20e/letters-to-m-and-e/"><strong>Letters to M &amp; E</strong></a> series.
</div>

<div class="aside" style="margin-bottom:2.5rem; border-left:3px solid #1a1d1e; background:#f7f6f4;">
  <strong style="font-style:normal; color:#1a1d1e; font-size:0.78rem; letter-spacing:0.1em;">THREE CLAIMS ABOUT YOUR FUTURE</strong>
  <p style="margin:0.6rem 0 0; font-size:0.95rem; line-height:1.75; color:#3d4144; font-style:normal;"><strong>First:</strong> The traits you were born with - intelligence, conscientiousness, height - follow a bell curve: symmetric, mean-reverting, self-correcting across generations. The wealth you were born into does not. It follows a power law. Per standard deviation, inherited wealth predicts lifetime income more strongly than cognitive ability. And unlike intelligence, wealth does not regress toward the mean when it passes to the next generation - it compounds.</p>
  <p style="margin:0.7rem 0 0; font-size:0.95rem; line-height:1.75; color:#3d4144; font-style:normal;"><strong>Second:</strong> The historical wire connecting intelligence to income - IQ &#8594; credentials &#8594; high-paying knowledge work - is being cut by artificial intelligence. The IQ premium in the labour market is collapsing. The capital premium is not.</p>
  <p style="margin:0.7rem 0 0; font-size:0.95rem; line-height:1.75; color:#3d4144; font-style:normal;"><strong>Third:</strong> The consequences run in two directions. First, structurally: when the bridge closes, the wealth tier stops absorbing new entrants. The door that cognitive ability could once open no longer exists. Second, through mating: without credentials as a sorting signal, assortative mating shifts toward wealth directly - not dramatically, but in which signals carry weight. Three or four generations of that separation produces aristocracy - not by decree, but by mathematics. The transition is not yet complete. Domain expertise combined with AI fluency still commands a premium not gated by inherited wealth. The first wave (AI) removes the knowledge-work bridge. The second wave (robotics) is building behind it and will remove the physical-work floor - the survival income that was never a wealth-building path, but whose disappearance will seal the bottom tier&#8217;s exit route for a generation. That window closes when the integration matures. Act accordingly.</p>
</div>

<p class="dropcap">You are running on two clocks simultaneously, and they have opposite mechanics. The first clock is biological. It governs intelligence, personality, physical traits - everything transmitted through chromosomes. This clock regresses toward the mean. The child of two people with IQs of 135 will, on average, have an IQ closer to 115. Genes are shuffled at every conception. Extreme values are diluted. The biological clock self-corrects.</p>

<p>The second clock is legal. It governs wealth - everything transmitted through property law, through wills and trusts and alumni networks and the step-up in basis at death. This clock compounds. A house valued at $2 million does not become worth $1 million when it is inherited - it appreciates. Capital earns returns. There is no meiosis for money.</p>

<p>These two clocks meet at a threshold. Below roughly $20,000 in net worth - where about a quarter of American households live - the compounding mechanism does not operate at all: income is consumed by subsistence, savings cannot activate, and the second clock simply stops. Above it, the clock runs independently of traits, accelerating with the size of the initial position. The floor is not merely hard to escape from. It is, mathematically, a different country.</p>

<!-- ── FIGURE 1: SAMPLING SIMULATION ─────────────────────── -->

<div class="viz-widget" style="padding:0;">
  <div style="padding:0.9rem 1rem 0.6rem; border-bottom:1px solid var(--viz-border);">
    <span class="viz-tag">Figure 1 - Interactive Simulation</span>
    <span class="viz-title-text">Traits &#215; Inherited Wealth &#8594; Household Income</span>
  </div>

  <div style="display:grid; grid-template-columns:1fr 1fr; gap:1px; background:var(--viz-border);">
    <div style="background:#fff; padding:0.55rem 0.7rem 0.4rem;">
      <div style="font-size:0.65rem; font-weight:700; text-transform:uppercase; letter-spacing:0.15em; color:var(--viz-accent); margin-bottom:0.15rem;">Panel 1 - Draw rectangle to select population</div>
      <div style="font-size:0.78rem; font-weight:700; color:#1a1d1e; margin-bottom:0.3rem;">Trait space: IQ &#215; Conscientiousness (&#961; = 0.25)</div>
      <canvas id="sim-trait-canvas" width="500" height="380" style="width:100%; display:block; cursor:crosshair;"></canvas>
    </div>
    <div style="background:#fff; padding:0.55rem 0.7rem 0.4rem;">
      <div style="font-size:0.65rem; font-weight:700; text-transform:uppercase; letter-spacing:0.15em; color:var(--viz-accent); margin-bottom:0.15rem;">Panel 2 - Drag bracket to select wealth range</div>
      <div style="font-size:0.78rem; font-weight:700; color:#1a1d1e; margin-bottom:0.3rem;">Starting net worth (US SCF 2022, log scale)</div>
      <canvas id="sim-wealth-canvas" width="500" height="380" style="width:100%; display:block; cursor:ew-resize;"></canvas>
    </div>
  </div>

  <div style="background:#f7f6f4; border-top:1px solid var(--viz-border); border-bottom:1px solid var(--viz-border); padding:0.6rem 0.8rem; display:flex; flex-wrap:wrap; gap:0.5rem 1.2rem; align-items:center; font-size:0.8rem; color:#6f777d;">
    <div style="display:flex; align-items:center; gap:0.4rem;">
      <span>Editing:</span>
      <div id="sim-tab-A" style="padding:0.2rem 0.7rem; border-radius:3px; cursor:pointer; font-weight:700; font-size:0.78rem; border:1.5px solid #8b3a1e; background:#8b3a1e; color:white;">Set A</div>
      <div id="sim-tab-B" style="padding:0.2rem 0.7rem; border-radius:3px; cursor:pointer; font-weight:700; font-size:0.78rem; border:1.5px solid #1a5c8a; color:#1a5c8a; background:white;">Set B</div>
    </div>
    <button id="sim-sample-btn" style="padding:0.25rem 0.8rem; border-radius:3px; cursor:pointer; font-weight:700; font-size:0.78rem; background:#1a1d1e; color:white; border:none;">&#9654; Sample</button>
    <button id="sim-clear-btn" style="padding:0.25rem 0.8rem; border-radius:3px; cursor:pointer; font-size:0.78rem; border:1px solid #f0b0a0; color:#c0391b; background:white;">&#10005; Clear</button>
    <div style="width:1px; height:22px; background:var(--viz-border);"></div>
    <div style="display:flex; align-items:center; gap:0.4rem; flex-wrap:wrap;">
      <span>Presets:</span>
      <span id="sim-preset-iq" style="padding:0.2rem 0.6rem; border-radius:3px; cursor:pointer; font-size:0.74rem; font-weight:700; border:1px solid var(--viz-border); background:white; color:#6f777d;">IQ vs Wealth</span>
      <span id="sim-preset-dynasty" style="padding:0.2rem 0.6rem; border-radius:3px; cursor:pointer; font-size:0.74rem; font-weight:700; border:1px solid var(--viz-border); background:white; color:#6f777d;">Dynasty</span>
      <span id="sim-preset-floor" style="padding:0.2rem 0.6rem; border-radius:3px; cursor:pointer; font-size:0.74rem; font-weight:700; border:1px solid var(--viz-border); background:white; color:#6f777d;">The Floor</span>
    </div>
    <div style="width:1px; height:22px; background:var(--viz-border);"></div>
    <div style="display:flex; align-items:center; gap:0.4rem;">
      <span>Assortative mating:</span>
      <input type="range" id="sim-am" min="0" max="100" value="70" style="width:90px;">
      <span id="sim-am-val" style="font-weight:700; color:var(--viz-accent); min-width:32px;">0.70</span>
    </div>
    <div style="display:flex; align-items:center; gap:0.4rem;" title="Reduce to model an AI economy where cognitive work is commoditised">
      <span style="color:#8b3a1e; font-weight:700;">IQ&#8594;income &#946;:</span>
      <input type="range" id="sim-biq" min="0" max="100" value="35" step="5" style="width:80px;">
      <span id="sim-biq-val" style="font-weight:700; color:#8b3a1e; min-width:32px;">0.35</span>
    </div>
    <div style="width:1px; height:22px; background:var(--viz-border);"></div>
    <div style="display:flex; align-items:center; gap:0.4rem;">
      <span>Generation:</span>
      <div style="display:flex; border:1px solid var(--viz-border); border-radius:3px; overflow:hidden;">
        <button id="sim-gen0" style="padding:0.2rem 0.6rem; font-size:0.74rem; font-weight:700; cursor:pointer; background:#1a1d1e; color:white; border:none; outline:none;">This gen</button>
        <button id="sim-gen1" style="padding:0.2rem 0.6rem; font-size:0.74rem; font-weight:700; cursor:pointer; background:white; color:#6f777d; border:none; outline:none;">Children</button>
      </div>
    </div>
  </div>

  <div style="background:#fff; padding:0.55rem 0.7rem 0.4rem;">
    <div style="font-size:0.65rem; font-weight:700; text-transform:uppercase; letter-spacing:0.15em; color:var(--viz-accent); margin-bottom:0.15rem;">Outcome - Household Income Distribution</div>
    <canvas id="sim-outcome-canvas" width="960" height="240" style="width:100%; display:block;"></canvas>
  </div>

  <div id="sim-stats" style="display:flex; flex-wrap:wrap; gap:0.8rem 2rem; padding:0.5rem 0.8rem; background:#f7f6f4; border-top:1px solid var(--viz-border); font-size:0.8rem;">
    <div><div style="font-size:0.65rem; text-transform:uppercase; letter-spacing:0.1em; color:#6f777d;">Set A median</div><div id="sim-stat-a-med" style="font-weight:700; color:#8b3a1e;">-</div></div>
    <div><div style="font-size:0.65rem; text-transform:uppercase; letter-spacing:0.1em; color:#6f777d;">Set A P25&#8211;P75</div><div id="sim-stat-a-iqr" style="font-weight:700; color:#8b3a1e;">-</div></div>
    <div><div style="font-size:0.65rem; text-transform:uppercase; letter-spacing:0.1em; color:#6f777d;">Set A P90</div><div id="sim-stat-a-p90" style="font-weight:700; color:#8b3a1e;">-</div></div>
    <div style="width:1px; background:var(--viz-border);"></div>
    <div><div style="font-size:0.65rem; text-transform:uppercase; letter-spacing:0.1em; color:#6f777d;">Set B median</div><div id="sim-stat-b-med" style="font-weight:700; color:#1a5c8a;">-</div></div>
    <div><div style="font-size:0.65rem; text-transform:uppercase; letter-spacing:0.1em; color:#6f777d;">Set B P25&#8211;P75</div><div id="sim-stat-b-iqr" style="font-weight:700; color:#1a5c8a;">-</div></div>
    <div><div style="font-size:0.65rem; text-transform:uppercase; letter-spacing:0.1em; color:#6f777d;">Set B P90</div><div id="sim-stat-b-p90" style="font-weight:700; color:#1a5c8a;">-</div></div>
    <div style="width:1px; background:var(--viz-border);"></div>
    <div><div style="font-size:0.65rem; text-transform:uppercase; letter-spacing:0.1em; color:#6f777d;">Difference</div><div id="sim-stat-diff" style="font-weight:700; color:#1a1d1e;">-</div></div>
  </div>


  <div class="viz-caption" style="border-top:none; padding:0.7rem 1rem 0.9rem;">Try <strong>IQ vs Wealth</strong> - notice how close the medians are. Switch to <strong>Children</strong> and push assortative mating to 0.9 - watch the legal channel compound undiluted while traits regress. Try <strong>Dynasty</strong> (exceptional traits vs top-1% wealth) and <strong>The Floor</strong> (identical average traits, one group below $20k). Reduce <em>IQ&#8594;income &#946;</em> to 0.10 to model an AI economy: watch what happens to the gap.</div>
</div>

<p>For most of human history, the wire connecting intelligence to heritable wealth did not exist. Before the bourgeois revolutions of the late eighteenth century, a brilliant peasant had no mechanism to convert that endowment into capital. Wealth ran through blood and title. Traits recirculated within class. The two clocks ran independently.</p>

<p>The French Revolution and industrial capitalism built a bridge. For the first time at scale, cognitive ability could be converted into credentials, and credentials into heritable wealth. The biological and legal channels began to couple. The meritocracy was always imperfect - the bell curve and the power law were never fully joined - but the bridge existed. It changed who the locked-in class was. The bridge was not a natural phenomenon. It was words. Which means it can be unwritten with new ones.</p>

<p>Artificial intelligence is dismantling that bridge. Large language models already match median professional performance on the tasks that constitute most professional billing hours in law, finance, medicine, and software. This is not a prediction. It is 2026. The junior lawyer billing for research a model does in seconds is not being made more productive. They are being made unnecessary. Andrej Karpathy&#8217;s <a href="https://karpathy.ai/jobs/" target="_blank" rel="noopener">AI job-exposure visualiser</a> maps 342 occupations by how thoroughly AI reshapes them: software engineers, data analysts, and paralegals all score 8&#8211;9 out of 10. Roofers and plumbers anchor the low end. That is not a coincidence. It is the shape of Wave 1.</p>

<p>The protection that physical work offers in Wave 1 is exactly one generation deep. The plumber&#8217;s job survives. But the first-rung knowledge job the plumber&#8217;s child would have taken - data entry, basic paralegal research, entry-level accounting, junior software testing - is precisely what AI automates first. The mobility ladder is not being pulled up from the top. It is being disassembled from the middle, while the families who most need it are still on the bottom rung.</p>

<p>The current model gives wealth a larger coefficient than intelligence - per standard deviation, it predicts income more strongly. That IQ premium is a historical artefact reflecting a century of scarcity of cognitive work. That scarcity is ending. A plausible trajectory over the next fifteen years puts the IQ coefficient somewhere between 0.10 and 0.20. The wealth coefficient, meanwhile, rises - capital owns the AI, and the productivity gains from AI disproportionately accrue to the shareholders of the companies that own the models. The multiplication still holds. But now one factor dominates almost entirely. The standard Jevons reassurance - that cheaper cognitive work unlocks so much latent demand that total knowledge-work employment expands - probably contains some truth; but the productivity surplus accrues to capital owners, not displaced workers, and the adjustment timeline is measured in single careers, not generations.</p>

<blockquote>
  <p>The coming disruption does not flatten the bell curve. It severs the wire connecting the bell curve to the income distribution.</p>
</blockquote>

<p>But the transition creates a window. AI tools now exist that can dramatically amplify the output of a domain expert - a nurse, a logistics manager, a structural engineer, a teacher, a lawyer, a radiologist - who understands both their domain deeply and what the tools can and cannot reliably do. That combination is currently scarce. It will not remain scarce: as workflows standardise and vendors commoditise the integration, the premium for being early will compress toward zero. The window is open now, probably for five to seven more years in most domains. The people who build at that intersection - who take a decade of domain knowledge and apply it to AI integration before the market has priced it - are capturing a transition premium that is not gated by inherited wealth. It is gated by speed, domain depth, and the willingness to act before the outcome is obvious. Those are things a person with cognitive ability and modest starting wealth can actually have. The simulation below shows what comes after the window closes: five generations of what regresses and what compounds. Set your own starting positions, then reduce the IQ&#8594;income &#946; to 0.10 - the AI-economy scenario. Watch what trait advantage does to the wealth rows. The window is the gap between those two runs.</p>

<p>A second wave is already building in the background. Industrial robot density doubled in seven years according to the IFR; Amazon runs over a million robots in its fulfilment centres; $6 billion flowed into robotics startups in the first seven months of 2025 alone. The physical jobs that AI cannot yet replace - construction, care, logistics - are already being automated at industrial scale in spaces most people never see. When that automation crosses into visible everyday domains, the adjustment will feel sudden rather than gradual. But the deeper point is economic: physical jobs were never the low-capital path to heritable wealth. They were the survival floor - income sufficient to live on, but structurally insufficient to clear the $20k wealth threshold and enter the compounding tier. Knowledge work was the only bridge between cognitive ability and that tier. AI is pulling that bridge up. Robotics will then remove the floor. The two waves together extend the consolidation window from one decade to two or three - and make the arithmetic deadline for the first wave more, not less, urgent.</p>

<!-- ── FIGURE 2: DYNASTY SIMULATION ───────────────────────── -->

<div class="viz-widget" style="padding:0;">
  <div style="padding:0.9rem 1rem 0.6rem; border-bottom:1px solid var(--viz-border);">
    <span class="viz-tag">Figure 2 - Interactive Simulation</span>
    <span class="viz-title-text">Family Dynasty: Five Generations of Traits and Wealth</span>
  </div>

  <div style="display:grid; grid-template-columns:1fr 1fr; gap:1px; background:var(--viz-border);">
    <div style="background:#fff; padding:0.55rem 0.7rem 0.4rem;">
      <div style="font-size:0.65rem; font-weight:700; text-transform:uppercase; letter-spacing:0.15em; color:var(--viz-accent); margin-bottom:0.15rem;">Panel 1 - Click or drag to position each founder</div>
      <div style="font-size:0.78rem; font-weight:700; color:#1a1d1e; margin-bottom:0.3rem;">Trait space: IQ &#215; Conscientiousness (&#961; = 0.25)</div>
      <canvas id="f7-trait-canvas" width="500" height="380" style="width:100%; display:block; cursor:crosshair;"></canvas>
    </div>
    <div style="background:#fff; padding:0.55rem 0.7rem 0.4rem;">
      <div style="font-size:0.65rem; font-weight:700; text-transform:uppercase; letter-spacing:0.15em; color:var(--viz-accent); margin-bottom:0.15rem;">Panel 2 - Drag to set each founder's starting wealth</div>
      <div style="font-size:0.78rem; font-weight:700; color:#1a1d1e; margin-bottom:0.3rem;">Starting net worth (US SCF 2022, log scale)</div>
      <canvas id="f7-wealth-canvas" width="500" height="380" style="width:100%; display:block; cursor:ew-resize;"></canvas>
    </div>
  </div>

  <div style="background:#f7f6f4; border-top:1px solid var(--viz-border); border-bottom:1px solid var(--viz-border); padding:0.6rem 0.8rem; display:flex; flex-wrap:wrap; gap:0.5rem 1.2rem; align-items:center; font-size:0.8rem; color:#6f777d;">
    <div style="display:flex; align-items:center; gap:0.4rem;">
      <span>Editing:</span>
      <div id="f7-person-a" style="padding:0.2rem 0.7rem; border-radius:3px; cursor:pointer; font-weight:700; font-size:0.78rem; border:1.5px solid #8b3a1e; background:#8b3a1e; color:white;">Founder A</div>
      <div id="f7-person-b" style="padding:0.2rem 0.7rem; border-radius:3px; cursor:pointer; font-weight:700; font-size:0.78rem; border:1.5px solid #1a5c8a; color:#1a5c8a; background:white;">Founder B</div>
    </div>
    <button id="f7-sim-btn" style="padding:0.25rem 0.8rem; border-radius:3px; cursor:pointer; font-weight:700; font-size:0.78rem; background:#1a1d1e; color:white; border:none;">&#9654; Simulate</button>
    <button id="f7-reset-btn" style="padding:0.25rem 0.8rem; border-radius:3px; cursor:pointer; font-size:0.78rem; border:1px solid #f0b0a0; color:#c0391b; background:white;">&#8617; Reset</button>
    <div style="width:1px; height:22px; background:var(--viz-border);"></div>
    <div style="display:flex; align-items:center; gap:0.4rem;" title="Reduce to model an AI economy where cognitive work is commoditised">
      <span style="color:#8b3a1e; font-weight:700;">IQ&#8594;income &#946;:</span>
      <input type="range" id="f7-biq" min="0" max="100" value="35" step="5" style="width:80px;">
      <span id="f7-biq-val" style="font-weight:700; color:#8b3a1e; min-width:32px;">0.35</span>
    </div>
  </div>

  <div style="background:#fff; padding:0.55rem 0.7rem 0.4rem;">
    <div style="font-size:0.65rem; font-weight:700; text-transform:uppercase; letter-spacing:0.15em; color:var(--viz-accent); margin-bottom:0.15rem;">Outcome - Household Wealth by Generation <span style="font-weight:400; color:#888; font-size:0.6rem; text-transform:none; letter-spacing:0;">(log scale - this is the real story)</span></div>
    <canvas id="f7-wealth-joy-canvas" width="960" height="300" style="width:100%; display:block;"></canvas>
  </div>

  <div style="padding:0.5rem 0.8rem; background:#f7f6f4; border-top:1px solid var(--viz-border); overflow-x:auto;">
    <table style="font-size:0.78rem; border-collapse:collapse; width:100%; min-width:480px;">
      <thead>
        <tr style="border-bottom:1px solid var(--viz-border); color:#6f777d; text-transform:uppercase; letter-spacing:0.08em; font-size:0.65rem;">
          <th style="text-align:left; padding:0.3rem 0.6rem;">Generation</th>
          <th style="text-align:right; padding:0.3rem 0.6rem;">People</th>
          <th style="text-align:right; padding:0.3rem 0.6rem;">Median income</th>
          <th style="text-align:right; padding:0.3rem 0.6rem;">Median wealth</th>
          <th style="text-align:right; padding:0.3rem 0.6rem;">Avg IQ</th>
        </tr>
      </thead>
      <tbody id="f7-stats-body">
        <tr><td colspan="5" style="text-align:center; color:#aab; padding:0.6rem; font-style:italic;">Run the simulation to see results</td></tr>
      </tbody>
    </table>
  </div>

  <!-- hidden dummy elements the Fig 7 IIFE wires up but we don't show -->
  <div style="display:none;">
    <input type="range" id="f7-kids" value="20">
    <span id="f7-kids-val"></span>
    <input type="range" id="f7-am" value="70">
    <span id="f7-am-val"></span>
    <canvas id="f7-gen-canvas" width="960" height="300"></canvas>
  </div>

  <div class="viz-caption" style="border-top:none; padding:0.7rem 1rem 0.9rem;">Place <strong>Founder A</strong> (terracotta) and <strong>Founder B</strong> (blue) by clicking or dragging in both canvases, then click <strong>&#9654; Simulate</strong>. Watch what regresses (IQ) and what compounds (wealth). Then set <em>IQ&#8594;income &#946;</em> to 0.10: trait advantage collapses while the wealth rows hold.</div>
</div>

<p>The predictions are specific enough to be falsifiable. Within the next decade: the income share captured by capital will rise to levels not seen since before the New Deal. The correlation between professional income and inherited wealth within the same households will increase measurably. Assortative mating will shift from sorting on credentials toward sorting on net worth directly, as the credential screen loses its signal value. Watch the Bureau of Labor Statistics wage data against S&amp;P 500 earnings-per-share growth. Watch the labour share of GDP. These numbers are published quarterly. The model says they will diverge. The current trajectory suggests they already are. And if they diverge as predicted - if the wire severs on the timeline the model implies - then the window described above is not a metaphor. It is an arithmetic deadline.</p>

<p>The biological clock self-corrects. The legal clock does not. AI dismantles the knowledge-work bridge first - Wave 1. Robotics is building behind it and will eventually remove the physical-work floor - Wave 2. The combined effect leaves capital ownership as the only income source that doesn't erode. The window before Wave 1 closes is roughly the next decade.</p>
<p>The legal mechanisms keeping the compounding tier locked are specific and changeable. The step-up in basis at death. Dynasty trust laws in sixteen US states. An estate tax threshold of $13.6 million. Words in documents, written by people who knew exactly what they were doing. Rewritable by people who understand it better.</p>

<p><strong>Run the model on yourself - then read the full essay.</strong></p>

<div class="viz-widget" id="f9-widget" style="padding:0;">
  <div style="padding:0.9rem 1rem 0.6rem; border-bottom:1px solid var(--viz-border);">
    <span class="viz-tag">Figure 3 - Interactive Calculator</span>
    <span class="viz-title-text">Where Are You? Your Position in the Repricing</span>
  </div>
  <div style="background:#f7f6f4; border-bottom:1px solid var(--viz-border); padding:0.7rem 1rem; display:flex; flex-direction:column; gap:0.6rem;">
    <div style="display:flex; align-items:center; gap:0.7rem; flex-wrap:wrap;">
      <span style="font-weight:700; color:#1a1d1e; font-size:0.8rem; min-width:160px;">IQ percentile</span>
      <input type="range" id="f9-iq" min="1" max="99" value="70" step="1" style="width:160px;">
      <span id="f9-iq-label" style="font-weight:700; color:#1a1d1e; font-size:0.82rem; min-width:80px;">70th pct</span>
    </div>
    <div style="display:flex; align-items:center; gap:0.7rem; flex-wrap:wrap;">
      <span style="font-weight:700; color:#1a1d1e; font-size:0.8rem; min-width:160px;">Starting wealth percentile</span>
      <input type="range" id="f9-wealth" min="1" max="99" value="40" step="1" style="width:160px;">
      <span id="f9-wealth-label" style="font-weight:700; color:#1a1d1e; font-size:0.82rem; min-width:80px;">40th pct</span>
    </div>
    <div style="display:flex; flex-direction:column; gap:0.2rem;">
      <div style="display:flex; align-items:center; gap:0.7rem; flex-wrap:wrap;">
        <span style="font-weight:700; color:#1a1d1e; font-size:0.8rem; min-width:160px;">AI readiness</span>
        <input type="range" id="f9-ready" min="0" max="100" value="25" step="1" style="width:160px;">
        <span id="f9-ready-label" style="font-weight:700; color:#8b3a1e; font-size:0.82rem; min-width:80px;">25 / 100</span>
      </div>
      <div style="font-size:0.7rem; color:#9a9fa5; font-style:italic; padding-left:167px;">0 = deep domain expertise, no AI integration &nbsp;&#183;&nbsp; 100 = deep expertise + full AI workflow integration</div>
    </div>
  </div>
  <div style="display:flex; flex-wrap:wrap; gap:0; border-bottom:1px solid var(--viz-border);">
    <div style="flex:1; min-width:160px; padding:0.8rem 1rem; border-right:1px solid var(--viz-border);">
      <div style="font-size:0.63rem; text-transform:uppercase; letter-spacing:0.1em; color:#6f777d;">Current income</div>
      <div id="f9-income-now" style="font-weight:700; font-size:1.3rem; color:#1a1d1e; margin-top:0.2rem;">-</div>
      <div style="font-size:0.72rem; color:#9a9fa5;">per year, 2026 model</div>
    </div>
    <div style="flex:1; min-width:160px; padding:0.8rem 1rem; border-right:1px solid var(--viz-border);">
      <div style="font-size:0.63rem; text-transform:uppercase; letter-spacing:0.1em; color:#6f777d;">AI-world income</div>
      <div id="f9-income-ai" style="font-weight:700; font-size:1.3rem; color:#1a1d1e; margin-top:0.2rem;">-</div>
      <div id="f9-income-ai-note" style="font-size:0.72rem; color:#9a9fa5;">per year, Phase 3 model</div>
    </div>
    <div style="flex:1; min-width:160px; padding:0.8rem 1rem;">
      <div style="font-size:0.63rem; text-transform:uppercase; letter-spacing:0.1em; color:#6f777d;">Your window opportunity</div>
      <div id="f9-opportunity" style="font-weight:700; font-size:1.1rem; color:#8b3a1e; margin-top:0.2rem; line-height:1.3;">-</div>
      <div style="font-size:0.72rem; color:#9a9fa5;">acting now vs staying put</div>
    </div>
  </div>
  <div style="padding:0.7rem 1rem 0.5rem; background:#fff;">
    <div style="font-size:0.72rem; font-weight:700; color:#555; text-transform:uppercase; letter-spacing:0.08em; margin-bottom:0.5rem;">Your children&#8217;s expected position (one child, AI-world coefficients)</div>
    <table style="width:100%; border-collapse:collapse; font-size:0.8rem;">
      <thead>
        <tr style="border-bottom:1px solid #e0e0e0;">
          <th style="text-align:left; padding:0.3rem 0.5rem 0.3rem 0; color:#6f777d; font-weight:600;">Scenario</th>
          <th style="text-align:left; padding:0.3rem 0.5rem; color:#6f777d; font-weight:600;">Starting wealth</th>
          <th style="text-align:left; padding:0.3rem 0.5rem; color:#6f777d; font-weight:600;">Compounding tier</th>
          <th style="text-align:left; padding:0.3rem 0; color:#6f777d; font-weight:600;">AI-world income</th>
        </tr>
      </thead>
      <tbody>
        <tr style="border-bottom:1px solid #f0f0f0;">
          <td style="padding:0.4rem 0.5rem 0.4rem 0; font-weight:700; color:#1a5c8a;">If you act now</td>
          <td id="f9-child-act-wealth" style="padding:0.4rem 0.5rem;">-</td>
          <td id="f9-child-act-tier" style="padding:0.4rem 0.5rem;">-</td>
          <td id="f9-child-act-income" style="padding:0.4rem 0; font-weight:700;">-</td>
        </tr>
        <tr>
          <td style="padding:0.4rem 0.5rem 0.4rem 0; font-weight:700; color:#8b3a1e;">If you don&#8217;t act</td>
          <td id="f9-child-no-wealth" style="padding:0.4rem 0.5rem;">-</td>
          <td id="f9-child-no-tier" style="padding:0.4rem 0.5rem;">-</td>
          <td id="f9-child-no-income" style="padding:0.4rem 0; font-weight:700;">-</td>
        </tr>
      </tbody>
    </table>
    <div style="font-size:0.68rem; color:#9a9fa5; margin-top:0.35rem; font-style:italic;">Assumes one child, 50% wealth transfer, IQ regression to mean (child&#8217;s z&nbsp;=&nbsp;0.5&nbsp;&#215;&nbsp;parent&#8217;s z), Phase 3 income coefficients.</div>
  </div>
  <div class="viz-caption" style="border-top:1px solid var(--viz-border); padding:0.7rem 1rem 0.9rem;">
    Move the sliders to your own position. <strong>AI-world income</strong> uses Phase 3 coefficients (&#946;<sub>IQ</sub>&nbsp;=&nbsp;0.10, &#946;<sub>W</sub>&nbsp;=&nbsp;0.65) - the destination, not the current state. <strong>Window opportunity</strong> is the lifetime income difference between acting now (readiness&nbsp;&#8594;&nbsp;80) versus staying at your current readiness, expressed as total income and estimated wealth accumulation at a 20% savings rate over the 6-year window. The <strong>children&#8217;s table</strong> shows the intergenerational impact of that single decision.
  </div>
</div>

<div class="tldr-cta">
  <div class="tldr-cta-label">The bridge is being pulled up.</div>
  <p style="margin:0 0 0.8rem; font-size:1.05rem; line-height:1.6;">The full essay builds the complete case across five sections - with all nine interactive figures, detailed theoretical background, and a closing letter to the next generation.</p>
  <a href="/m%20&%20e/ai/your-bridge-to-wealth-is-being-pulled-up/">Read &#8220;Your Bridge to Wealth Is Being Pulled Up&#8221; &#8594;</a>
</div>

<div class="viz-tooltip" id="tooltip"></div>

<script>
/* ============================================================
   FIGURE 1 (TLDR) - PRIVILEGE SIMULATOR - injected below
   ============================================================ */
/* ============================================================
   FIGURE 6 - PRIVILEGE SIMULATOR (self-contained IIFE)
   ============================================================ */
(function() {
'use strict';

/* ================================================================
   CONSTANTS & MODEL
   ================================================================ */
let B_IQ        = 0.35;
const B_CONSC   = 0.25;
const B_WEALTH  = 0.45;
const RESID_SD  = 0.70;
const RHO_TRAITS = 0.25;   // IQ–conscientiousness correlation
const H2_IQ     = 0.60;   // IQ heritability
const H2_CONSC  = 0.45;   // conscientiousness heritability
const IND_INCOME_MEDIAN = 40000;   // individual income anchor ($)
const LOG_INCOME_SD     = 0.90;    // log-normal SD for income
const WEALTH_LOG_MEAN   = 5.20;    // log10($160k) ≈ median positive wealth
const WEALTH_LOG_SD     = 1.05;    // SD of log10(wealth)
const N_SAMPLES  = 350;
const ANIM_RATE  = 7;     // samples added per animation frame

// SCF 2022 wealth percentile lookup [percentile (0-1), log10(dollars)]
const WEALTH_TABLE = [
  [0.00, 1.0], [0.11, 2.0], [0.20, 3.70], [0.30, 4.45], [0.40, 4.92],
  [0.50, 5.29], [0.60, 5.53], [0.70, 5.77], [0.80, 6.00],
  [0.90, 6.40], [0.95, 6.71], [0.99, 7.04], [1.00, 7.70]
];
// Wealth threshold: below $20k, no compound savings possible (paycheck-to-paycheck)
// Below $1k: debt erosion
const WEALTH_ACCUM_THRESHOLD = 20000;
const WEALTH_DEBT_THRESHOLD  = 1000;
const IQ_SAVINGS_SLOPE       = 0.04;  // each SD IQ above mean → +4pp savings rate

/* ================================================================
   MATH UTILITIES
   ================================================================ */
let _spareNormal = null;
function randNormal() {
  if (_spareNormal !== null) { const v = _spareNormal; _spareNormal = null; return v; }
  let u, v, s;
  do { u = Math.random()*2-1; v = Math.random()*2-1; s = u*u+v*v; } while (s>=1||s===0);
  const m = Math.sqrt(-2*Math.log(s)/s);
  _spareNormal = v * m;
  return u * m;
}

const ERF_A = [0.254829592, -0.284496736, 1.421413741, -1.453152027, 1.061405429];
const ERF_P = 0.3275911;
function erf(x) {
  const sign = x < 0 ? -1 : 1; x = Math.abs(x);
  const t = 1/(1+ERF_P*x);
  return sign*(1-(((((ERF_A[4]*t+ERF_A[3])*t+ERF_A[2])*t+ERF_A[1])*t+ERF_A[0])*t)*Math.exp(-x*x));
}
function normalCDF(x) { return 0.5*(1+erf(x/Math.SQRT2)); }
function normalPDF(x) { return Math.exp(-0.5*x*x)/Math.sqrt(2*Math.PI); }

// Rational approximation of inverse normal CDF (Beasley-Springer-Moro)
function probit(p) {
  if (p <= 0.0001) return -3.8; if (p >= 0.9999) return 3.8;
  const a=[-3.969683028665376e1,2.209460984245205e2,-2.759285104469687e2,1.383577518672690e2,-3.066479806614716e1,2.506628277459239];
  const b=[-5.447609879822406e1,1.615858368580409e2,-1.556989798598866e2,6.680131188771972e1,-1.328068155288572e1];
  const c=[-7.784894002430293e-3,-3.223964580411365e-1,-2.400758277161838,-2.549732539343734,4.374664141464968,2.938163982698783];
  const d=[7.784695709041462e-3,3.224671290700398e-1,2.445134137142996,3.754408661907416];
  const pL=0.02425, pH=1-pL;
  let q,r;
  if (p<pL){ q=Math.sqrt(-2*Math.log(p)); return (((((c[0]*q+c[1])*q+c[2])*q+c[3])*q+c[4])*q+c[5])/((((d[0]*q+d[1])*q+d[2])*q+d[3])*q+1); }
  if (p<=pH){ q=p-0.5; r=q*q; return (((((a[0]*r+a[1])*r+a[2])*r+a[3])*r+a[4])*r+a[5])*q/(((((b[0]*r+b[1])*r+b[2])*r+b[3])*r+b[4])*r+1); }
  q=Math.sqrt(-2*Math.log(1-p)); return -(((((c[0]*q+c[1])*q+c[2])*q+c[3])*q+c[4])*q+c[5])/((((d[0]*q+d[1])*q+d[2])*q+d[3])*q+1);
}

function log10FromPctile(p) {
  p = Math.max(0.001, Math.min(0.999, p));
  for (let i=1; i<WEALTH_TABLE.length; i++) {
    if (p <= WEALTH_TABLE[i][0]) {
      const t = (p-WEALTH_TABLE[i-1][0])/(WEALTH_TABLE[i][0]-WEALTH_TABLE[i-1][0]);
      return WEALTH_TABLE[i-1][1] + t*(WEALTH_TABLE[i][1]-WEALTH_TABLE[i-1][1]);
    }
  }
  return WEALTH_TABLE[WEALTH_TABLE.length-1][1];
}
function pctileFromLog10(lw) {
  lw = Math.max(WEALTH_TABLE[0][1], Math.min(WEALTH_TABLE[WEALTH_TABLE.length-1][1], lw));
  for (let i=1; i<WEALTH_TABLE.length; i++) {
    if (lw <= WEALTH_TABLE[i][1]) {
      const t=(lw-WEALTH_TABLE[i-1][1])/(WEALTH_TABLE[i][1]-WEALTH_TABLE[i-1][1]);
      return WEALTH_TABLE[i-1][0]+t*(WEALTH_TABLE[i][0]-WEALTH_TABLE[i-1][0]);
    }
  }
  return 1.0;
}

function wealthZFromLog10(lw) { return (lw - WEALTH_LOG_MEAN) / WEALTH_LOG_SD; }
function dollarsFromLog10(lw) { return Math.pow(10, lw); }
function formatDollars(d) {
  if (d >= 1e6) return '$' + (d/1e6).toFixed(1) + 'M';
  if (d >= 1e3) return '$' + Math.round(d/1000) + 'k';
  return '$' + Math.round(d);
}

/* ================================================================
   INCOME MODEL
   ================================================================ */
function computeIndividualIncome(iqZ, conscZ, wealthLog) {
  const wZ = wealthZFromLog10(wealthLog);
  const outcomeZ = B_IQ*iqZ + B_CONSC*conscZ + B_WEALTH*wZ + randNormal()*RESID_SD;
  return IND_INCOME_MEDIAN * Math.exp(outcomeZ * LOG_INCOME_SD);
}

function onBIQChange(val) { B_IQ = val / 100; document.getElementById('sim-biq-val').textContent = B_IQ.toFixed(2); }

function computePartner(iqZ, conscZ, wealthLog, am) {
  const sq = Math.sqrt(1 - am*am);
  const partnerIQ    = am * iqZ    + sq * randNormal();
  const partnerConsc = am * conscZ + sq * randNormal();
  // partner wealth: correlate in LOG space
  const personWZ = wealthZFromLog10(wealthLog);
  const partnerWZ = am * personWZ + sq * randNormal();
  const partnerWLog = WEALTH_LOG_MEAN + partnerWZ * WEALTH_LOG_SD;
  return { iqZ: partnerIQ, conscZ: partnerConsc, wealthLog: partnerWLog };
}

function computeChildGen(personIQ, personConsc, personWLog, partnerIQ, partnerConsc, partnerWLog, householdIncome) {
  // Trait midpoint regression
  const midIQ    = (personIQ + partnerIQ) / 2;
  const midConsc = (personConsc + partnerConsc) / 2;
  const childIQ    = midIQ    * Math.sqrt(H2_IQ)    + randNormal() * Math.sqrt(1 - H2_IQ/2);
  const childConsc = midConsc * Math.sqrt(H2_CONSC) + randNormal() * Math.sqrt(1 - H2_CONSC/2);

  // Wealth: threshold-gated compounding + IQ-adjusted savings
  const avgParentWealth = (Math.pow(10, personWLog) + Math.pow(10, partnerWLog)) / 2;
  const avgParentIQ     = (personIQ + partnerIQ) / 2;

  // Capital growth is threshold-gated: only above $20k can wealth compound
  let wealthGrow;
  if (avgParentWealth < WEALTH_DEBT_THRESHOLD)       wealthGrow = 0.85;  // debt erosion
  else if (avgParentWealth < WEALTH_ACCUM_THRESHOLD) wealthGrow = 1.0;   // no growth
  else                                               wealthGrow = 1.5;   // capital appreciates

  // Savings rate scales with IQ, but only above the accumulation threshold
  const savingsRate = avgParentWealth >= WEALTH_ACCUM_THRESHOLD
    ? Math.max(0, 0.12 + IQ_SAVINGS_SLOPE * avgParentIQ)
    : 0;

  const inheritedWealth = 0.85 * avgParentWealth * wealthGrow;
  const lifetimeSavings = householdIncome * 40 * savingsRate;
  const childWealth     = inheritedWealth + 0.15 * lifetimeSavings;
  const childWLog       = Math.log10(Math.max(100, childWealth));

  return { iqZ: childIQ, conscZ: childConsc, wealthLog: childWLog };
}

/* ================================================================
   STATE
   ================================================================ */
const state = {
  active: 'A',
  am: 0.70,
  gen: 0,
  sets: {
    A: {
      traitRect:  { x0: 0.5, y0: 0.5, x1: 2.5, y1: 2.5 },  // IQ z, consc z
      wealthRange: { lo: 0.45, hi: 0.65 },                   // percentile 0-1
      samples: [],
      color: '#8b3a1e',
      colorLight: 'rgba(139,58,30,0.15)',
    },
    B: {
      traitRect:  { x0: -0.5, y0: -0.5, x1: 1.0, y1: 1.0 },
      wealthRange: { lo: 0.70, hi: 0.90 },
      samples: [],
      color: '#1a5c8a',
      colorLight: 'rgba(26,92,138,0.15)',
    }
  },
  animating: false,
  animTarget: null,  // 'A' or 'B'
  animIdx: 0,
  pendingSamples: [],
};

/* ================================================================
   TRAIT CANVAS
   ================================================================ */
const traitCanvas = document.getElementById('sim-trait-canvas');
const traitCtx    = traitCanvas.getContext('2d');
const TC = { W: 500, H: 420, l: 55, t: 20, r: 20, b: 45 };
TC.pw = TC.W - TC.l - TC.r;
TC.ph = TC.H - TC.t - TC.b;
const T_MIN = -3.5, T_MAX = 3.5;
function tCx(z) { return TC.l + (z - T_MIN) / (T_MAX - T_MIN) * TC.pw; }
function tCy(z) { return TC.t + (1 - (z - T_MIN) / (T_MAX - T_MIN)) * TC.ph; }
function tInvX(px) { return T_MIN + (px - TC.l) / TC.pw * (T_MAX - T_MIN); }
function tInvY(py) { return T_MAX - (py - TC.t) / TC.ph * (T_MAX - T_MIN); }

let traitGaussianCache = null;
function buildTraitCache() {
  const img = traitCtx.createImageData(TC.W, TC.H);
  const d = img.data;
  const maxPDF = 1 / (2*Math.PI*Math.sqrt(1-RHO_TRAITS*RHO_TRAITS));
  for (let py = 0; py < TC.H; py++) {
    for (let px = 0; px < TC.W; px++) {
      const idx = (py*TC.W+px)*4;
      if (px < TC.l || px > TC.l+TC.pw || py < TC.t || py > TC.t+TC.ph) {
        d[idx]=250;d[idx+1]=250;d[idx+2]=250;d[idx+3]=255; continue;
      }
      const x = tInvX(px), y = tInvY(py);
      const q = (x*x - 2*RHO_TRAITS*x*y + y*y) / (2*(1-RHO_TRAITS*RHO_TRAITS));
      const pdf = Math.exp(-q) / (2*Math.PI*Math.sqrt(1-RHO_TRAITS*RHO_TRAITS));
      const t = Math.pow(pdf/maxPDF, 0.45);
      d[idx]   = Math.round(235 + (90-235)*t);
      d[idx+1] = Math.round(240 + (165-240)*t);
      d[idx+2] = Math.round(250 + (220-250)*t);
      d[idx+3] = 255;
    }
  }
  traitGaussianCache = img;
}

function drawTraitPanel() {
  if (!traitGaussianCache) buildTraitCache();
  traitCtx.putImageData(traitGaussianCache, 0, 0);

  // Grid & axes
  traitCtx.strokeStyle = '#cce'; traitCtx.lineWidth = 0.4;
  for (let v = -3; v <= 3; v++) {
    const cx2 = tCx(v), cy2 = tCy(v);
    if (v !== 0) {
      traitCtx.beginPath(); traitCtx.moveTo(cx2, TC.t); traitCtx.lineTo(cx2, TC.t+TC.ph); traitCtx.stroke();
      traitCtx.beginPath(); traitCtx.moveTo(TC.l, cy2); traitCtx.lineTo(TC.l+TC.pw, cy2); traitCtx.stroke();
    }
  }
  traitCtx.strokeStyle = '#aab'; traitCtx.lineWidth = 0.8;
  traitCtx.beginPath(); traitCtx.moveTo(TC.l, TC.t); traitCtx.lineTo(TC.l, TC.t+TC.ph); traitCtx.stroke();
  traitCtx.beginPath(); traitCtx.moveTo(TC.l, TC.t+TC.ph); traitCtx.lineTo(TC.l+TC.pw, TC.t+TC.ph); traitCtx.stroke();

  // Tick labels
  traitCtx.fillStyle='#8a9'; traitCtx.font='11px Spectral,serif'; traitCtx.textAlign='center';
  for (let v = -3; v <= 3; v++) {
    if (v === 0) continue;
    const cx2 = tCx(v); const iqPt = Math.round(100 + v*15);
    traitCtx.fillText(v+'σ', cx2, TC.t+TC.ph+14);
    traitCtx.fillStyle='#8a9'; traitCtx.textAlign='right';
    traitCtx.fillText(v+'σ', TC.l-5, tCy(v)+4);
    traitCtx.textAlign='center';
  }
  // IQ labels
  traitCtx.fillStyle='#556'; traitCtx.font='italic 10px Spectral,serif';
  [-2,-1,0,1,2].forEach(v => {
    traitCtx.fillText('IQ '+(100+v*15), tCx(v), TC.t+TC.ph+26);
  });
  traitCtx.fillStyle='#556'; traitCtx.font='italic 12px Lato,sans-serif'; traitCtx.textAlign='center';
  traitCtx.fillText('IQ (z-score)', TC.l+TC.pw/2, TC.H-3);
  traitCtx.save(); traitCtx.translate(13, TC.t+TC.ph/2); traitCtx.rotate(-Math.PI/2);
  traitCtx.fillText('Conscientiousness', 0, 0); traitCtx.restore();

  // Draw both selection rectangles
  ['B','A'].forEach(key => {
    const s = state.sets[key];
    const r = s.traitRect;
    const x1 = tCx(r.x0), y1 = tCy(r.y1);  // note y is flipped
    const x2 = tCx(r.x1), y2 = tCy(r.y0);
    const w = x2-x1, h = y2-y1;
    // Fill
    traitCtx.fillStyle = s.colorLight;
    traitCtx.fillRect(x1, y1, w, h);
    // Border
    traitCtx.strokeStyle = s.color;
    traitCtx.lineWidth = key === state.active ? 2.5 : 1.5;
    traitCtx.setLineDash(key === state.active ? [] : [5,4]);
    traitCtx.strokeRect(x1, y1, w, h);
    traitCtx.setLineDash([]);
    // Label
    traitCtx.fillStyle = s.color;
    traitCtx.font = 'bold 11px Lato,sans-serif'; traitCtx.textAlign='left';
    traitCtx.fillText('Set '+key, x1+4, y1+14);
  });

  // Draw sampled dots (recent samples for current active set)
  ['A','B'].forEach(key => {
    const s = state.sets[key];
    const recent = s.samples.slice(-60);
    recent.forEach((sp, i) => {
      const alpha = (i / recent.length) * 0.6 + 0.1;
      traitCtx.beginPath();
      traitCtx.arc(tCx(sp.iqZ), tCy(sp.conscZ), 2.5, 0, 2*Math.PI);
      traitCtx.fillStyle = s.color.replace(')', `,${alpha.toFixed(2)})`).replace('rgb', 'rgba').replace('#8b3a1e', `rgba(139,58,30,${alpha.toFixed(2)})`).replace('#1a5c8a', `rgba(26,92,138,${alpha.toFixed(2)})`);
      traitCtx.fill();
    });
  });
}

/* ================================================================
   WEALTH CANVAS
   ================================================================ */
const wealthCanvas = document.getElementById('sim-wealth-canvas');
const wealthCtx    = wealthCanvas.getContext('2d');
const WC = { W: 500, H: 420, l: 55, t: 20, r: 20, b: 45 };
WC.pw = WC.W - WC.l - WC.r;
WC.ph = WC.H - WC.t - WC.b;
const W_LOG_MIN = 1.5, W_LOG_MAX = 7.8;
function wCx(log10w) { return WC.l + (log10w - W_LOG_MIN) / (W_LOG_MAX - W_LOG_MIN) * WC.pw; }
function wInvX(px)   { return W_LOG_MIN + (px - WC.l) / WC.pw * (W_LOG_MAX - W_LOG_MIN); }

let wealthDensity = null;
function buildWealthDensity() {
  const N = 300;
  const pts = [];
  let maxD = 0;
  for (let i = 0; i <= N; i++) {
    const lw = W_LOG_MIN + (W_LOG_MAX - W_LOG_MIN) * i / N;
    const p1 = pctileFromLog10(lw - 0.06);
    const p2 = pctileFromLog10(lw + 0.06);
    const d = (p2 - p1) / 0.12;
    pts.push([lw, d]);
    if (d > maxD) maxD = d;
  }
  wealthDensity = { pts, maxD };
}

function drawWealthPanel() {
  if (!wealthDensity) buildWealthDensity();
  const { pts, maxD } = wealthDensity;

  wealthCtx.clearRect(0, 0, WC.W, WC.H);
  wealthCtx.fillStyle = '#f9f9f8';
  wealthCtx.fillRect(0, 0, WC.W, WC.H);

  // Vertical grid
  for (let e = 2; e <= 7; e++) {
    const x = wCx(e);
    wealthCtx.strokeStyle = '#e0e8e0'; wealthCtx.lineWidth = 0.5;
    wealthCtx.beginPath(); wealthCtx.moveTo(x, WC.t); wealthCtx.lineTo(x, WC.t+WC.ph); wealthCtx.stroke();
  }
  // Axis
  wealthCtx.strokeStyle = '#aab'; wealthCtx.lineWidth = 0.8;
  wealthCtx.beginPath(); wealthCtx.moveTo(WC.l, WC.t); wealthCtx.lineTo(WC.l, WC.t+WC.ph); wealthCtx.stroke();
  wealthCtx.beginPath(); wealthCtx.moveTo(WC.l, WC.t+WC.ph); wealthCtx.lineTo(WC.l+WC.pw, WC.t+WC.ph); wealthCtx.stroke();

  // Both selection brackets (drawn first, behind)
  ['B','A'].forEach(key => {
    const s = state.sets[key];
    const x1 = wCx(log10FromPctile(s.wealthRange.lo));
    const x2 = wCx(log10FromPctile(s.wealthRange.hi));
    wealthCtx.fillStyle = s.colorLight;
    wealthCtx.fillRect(x1, WC.t, x2-x1, WC.ph);
  });

  // Density area
  wealthCtx.beginPath();
  wealthCtx.moveTo(wCx(W_LOG_MIN), WC.t+WC.ph);
  pts.forEach(([lw,d]) => wealthCtx.lineTo(wCx(lw), WC.t + WC.ph - (d/maxD)*WC.ph*0.88));
  wealthCtx.lineTo(wCx(W_LOG_MAX), WC.t+WC.ph);
  wealthCtx.closePath();
  wealthCtx.fillStyle = 'rgba(100,140,100,0.12)'; wealthCtx.fill();
  wealthCtx.strokeStyle = '#5a8a5a'; wealthCtx.lineWidth = 1.5;
  wealthCtx.beginPath();
  pts.forEach(([lw,d],i) => { const px=wCx(lw), py=WC.t+WC.ph-(d/maxD)*WC.ph*0.88; i===0?wealthCtx.moveTo(px,py):wealthCtx.lineTo(px,py); });
  wealthCtx.stroke();

  // Selection brackets: borders & handles
  ['A','B'].forEach(key => {
    const s = state.sets[key];
    const x1 = wCx(log10FromPctile(s.wealthRange.lo));
    const x2 = wCx(log10FromPctile(s.wealthRange.hi));
    wealthCtx.strokeStyle = s.color;
    wealthCtx.lineWidth = key === state.active ? 2.5 : 1.5;
    wealthCtx.setLineDash(key === state.active ? [] : [5,4]);
    wealthCtx.strokeRect(x1, WC.t, x2-x1, WC.ph);
    wealthCtx.setLineDash([]);
    // Handles
    [[x1,'◄'],[x2,'►']].forEach(([hx, sym]) => {
      wealthCtx.fillStyle = s.color;
      wealthCtx.fillRect(hx-5, WC.t+WC.ph/2-10, 10, 20);
      wealthCtx.fillStyle='white'; wealthCtx.font='8px sans-serif'; wealthCtx.textAlign='center';
      wealthCtx.fillText('║', hx, WC.t+WC.ph/2+3);
    });
    // Label
    const midX = (x1+x2)/2;
    wealthCtx.fillStyle=s.color; wealthCtx.font='bold 10px Lato'; wealthCtx.textAlign='center';
    wealthCtx.fillText('Set '+key, midX, WC.t+12);
    const loD = formatDollars(dollarsFromLog10(log10FromPctile(s.wealthRange.lo)));
    const hiD = formatDollars(dollarsFromLog10(log10FromPctile(s.wealthRange.hi)));
    wealthCtx.font='9px Spectral,serif'; wealthCtx.fillStyle=s.color;
    wealthCtx.fillText(`${loD} – ${hiD}`, midX, WC.t+24);
  });

  // X labels
  wealthCtx.fillStyle='#556'; wealthCtx.font='10px Spectral,serif'; wealthCtx.textAlign='center';
  const xlabels = {2:'$100',3:'$1k',4:'$10k',5:'$100k',6:'$1M',7:'$10M'};
  for (let e=2; e<=7; e++) wealthCtx.fillText(xlabels[e], wCx(e), WC.t+WC.ph+16);

  wealthCtx.fillStyle='#556'; wealthCtx.font='italic 12px Lato'; wealthCtx.textAlign='center';
  wealthCtx.fillText('Starting Net Worth (log scale)', WC.l+WC.pw/2, WC.H-3);

  // Reference lines
  const refs = [{v: 5.29, label:'Median $193k', col:'#888'}, {v:Math.log10(1060000), label:'Mean $1.06M', col:'#5a8'}];
  refs.forEach(({v,label,col}) => {
    const x = wCx(v);
    wealthCtx.strokeStyle=col; wealthCtx.lineWidth=1; wealthCtx.setLineDash([3,3]);
    wealthCtx.beginPath(); wealthCtx.moveTo(x,WC.t); wealthCtx.lineTo(x,WC.t+WC.ph); wealthCtx.stroke();
    wealthCtx.setLineDash([]);
    wealthCtx.fillStyle=col; wealthCtx.font='8.5px Spectral,serif'; wealthCtx.textAlign='left';
    wealthCtx.fillText(label, x+3, WC.t+WC.ph-6);
  });

  // Sampled dots (recent)
  ['A','B'].forEach(key => {
    const s = state.sets[key];
    s.samples.slice(-60).forEach((sp,i) => {
      const alpha = (i/60)*0.5+0.1;
      wealthCtx.beginPath();
      wealthCtx.arc(wCx(sp.wealthLog), WC.t+WC.ph*0.5+randNormal()*WC.ph*0.1, 2.5, 0, 2*Math.PI);
      const rgb = key==='A' ? `139,58,30` : `26,92,138`;
      wealthCtx.fillStyle = `rgba(${rgb},${alpha.toFixed(2)})`;
      wealthCtx.fill();
    });
  });
}

/* ================================================================
   OUTCOME CANVAS
   ================================================================ */
const outcomeCanvas = document.getElementById('sim-outcome-canvas');
const outcomeCtx    = outcomeCanvas.getContext('2d');
const OC = { W: 1000, H: 280, l: 70, t: 28, r: 20, b: 50 };
OC.pw = OC.W - OC.l - OC.r;
OC.ph = OC.H - OC.t - OC.b;

// Histogram bins: log-income from log10($15k) to log10($2M), 50 bins
const LOG_INC_MIN = Math.log10(15000), LOG_INC_MAX = Math.log10(2000000);
const N_BINS = 50;
function incToBin(inc) {
  const logI = Math.log10(Math.max(100, inc));
  return Math.floor((logI - LOG_INC_MIN) / (LOG_INC_MAX - LOG_INC_MIN) * N_BINS);
}
function binToX(b) { return OC.l + (b + 0.5) / N_BINS * OC.pw; }
function binToDollars(b) { return Math.pow(10, LOG_INC_MIN + (b+0.5)/N_BINS*(LOG_INC_MAX-LOG_INC_MIN)); }

function drawOutcomePanel() {
  const sA = state.sets.A.samples;
  const sB = state.sets.B.samples;

  outcomeCtx.clearRect(0, 0, OC.W, OC.H);
  outcomeCtx.fillStyle = '#fafaf8';
  outcomeCtx.fillRect(0, 0, OC.W, OC.H);

  if (sA.length === 0 && sB.length === 0) {
    outcomeCtx.fillStyle = '#aab'; outcomeCtx.font = 'italic 14px Spectral,serif';
    outcomeCtx.textAlign = 'center';
    outcomeCtx.fillText('Select regions in the panels above, then click ▶ Sample', OC.W/2, OC.H/2);
    return;
  }

  // Build histograms
  const histA = new Array(N_BINS).fill(0);
  const histB = new Array(N_BINS).fill(0);
  sA.forEach(sp => { const b = incToBin(sp.hhIncome); if (b>=0&&b<N_BINS) histA[b]++; });
  sB.forEach(sp => { const b = incToBin(sp.hhIncome); if (b>=0&&b<N_BINS) histB[b]++; });
  const maxCount = Math.max(1, ...histA, ...histB);

  // Background grid
  for (let i=0; i<=4; i++) {
    const y = OC.t + OC.ph - i/4*OC.ph;
    outcomeCtx.strokeStyle = '#e8e8e4'; outcomeCtx.lineWidth = 0.5;
    outcomeCtx.beginPath(); outcomeCtx.moveTo(OC.l, y); outcomeCtx.lineTo(OC.l+OC.pw, y); outcomeCtx.stroke();
  }

  // Reference lines: median US household income ($74k) and $200k
  const refs = [
    {inc:74580, label:'US median\n$74k', col:'rgba(100,100,100,0.5)'},
    {inc:200000, label:'$200k', col:'rgba(100,100,100,0.35)'},
  ];
  refs.forEach(({inc,label,col}) => {
    const logI = Math.log10(inc);
    const x = OC.l + (logI-LOG_INC_MIN)/(LOG_INC_MAX-LOG_INC_MIN)*OC.pw;
    outcomeCtx.strokeStyle=col; outcomeCtx.lineWidth=1; outcomeCtx.setLineDash([4,3]);
    outcomeCtx.beginPath(); outcomeCtx.moveTo(x,OC.t); outcomeCtx.lineTo(x,OC.t+OC.ph); outcomeCtx.stroke();
    outcomeCtx.setLineDash([]);
    outcomeCtx.fillStyle=col; outcomeCtx.font='8px Spectral,serif'; outcomeCtx.textAlign='center';
    label.split('\n').forEach((ln,i) => outcomeCtx.fillText(ln, x, OC.t+OC.ph-8-i*11));
  });

  const bw = OC.pw / N_BINS;

  // Draw bars: Set B first (behind)
  if (sB.length > 0) {
    histB.forEach((count, b) => {
      const barH = (count / maxCount) * OC.ph;
      outcomeCtx.fillStyle = 'rgba(26,92,138,0.5)';
      outcomeCtx.fillRect(OC.l + b*bw, OC.t+OC.ph-barH, bw-1, barH);
    });
  }
  // Set A on top
  if (sA.length > 0) {
    histA.forEach((count, b) => {
      const barH = (count / maxCount) * OC.ph;
      outcomeCtx.fillStyle = 'rgba(139,58,30,0.55)';
      outcomeCtx.fillRect(OC.l + b*bw, OC.t+OC.ph-barH, bw-1, barH);
    });
  }

  // Median lines
  function medianIncome(samples) {
    if (!samples.length) return 0;
    const sorted = [...samples.map(s=>s.hhIncome)].sort((a,b)=>a-b);
    return sorted[Math.floor(sorted.length/2)];
  }
  function percIncome(samples, pct) {
    if (!samples.length) return 0;
    const sorted = [...samples.map(s=>s.hhIncome)].sort((a,b)=>a-b);
    return sorted[Math.floor(sorted.length*pct)];
  }

  [[sA,'A','#8b3a1e'],[sB,'B','#1a5c8a']].forEach(([samples, key, col]) => {
    if (!samples.length) return;
    const med = medianIncome(samples);
    const logI = Math.log10(med);
    const x = OC.l + (logI-LOG_INC_MIN)/(LOG_INC_MAX-LOG_INC_MIN)*OC.pw;
    outcomeCtx.strokeStyle=col; outcomeCtx.lineWidth=2.5; outcomeCtx.setLineDash([]);
    outcomeCtx.beginPath(); outcomeCtx.moveTo(x,OC.t); outcomeCtx.lineTo(x,OC.t+OC.ph); outcomeCtx.stroke();
    outcomeCtx.fillStyle=col; outcomeCtx.font='bold 10px Lato,sans-serif'; outcomeCtx.textAlign='center';
    outcomeCtx.fillRect(x-28, OC.t-1, 56, 16);
    outcomeCtx.fillStyle='white';
    outcomeCtx.fillText('Median '+key+': '+formatDollars(med), x, OC.t+11);
    // Update stats
    if (key==='A') {
      document.getElementById('sim-stat-a-med').textContent = formatDollars(med);
      document.getElementById('sim-stat-a-iqr').textContent = formatDollars(percIncome(samples,0.25))+'–'+formatDollars(percIncome(samples,0.75));
      document.getElementById('sim-stat-a-p90').textContent = formatDollars(percIncome(samples,0.90));
    } else {
      document.getElementById('sim-stat-b-med').textContent = formatDollars(med);
      document.getElementById('sim-stat-b-iqr').textContent = formatDollars(percIncome(samples,0.25))+'–'+formatDollars(percIncome(samples,0.75));
      document.getElementById('sim-stat-b-p90').textContent = formatDollars(percIncome(samples,0.90));
    }
  });

  if (sA.length && sB.length) {
    const medA = medianIncome(sA), medB = medianIncome(sB);
    const pct = (sA.filter(s => {
      const r = Math.random(); return s.hhIncome > sB[Math.floor(r * sB.length)]?.hhIncome;
    }).length / Math.min(sA.length, 200) * 100).toFixed(0);
    document.getElementById('sim-stat-diff').textContent = (medA > medB ? 'A > B: ' : 'B > A: ') +
      Math.round(Math.abs(medA-medB)/Math.min(medA,medB)*100) + '% higher median';
  }

  // X-axis ticks and labels
  outcomeCtx.strokeStyle = '#aab'; outcomeCtx.lineWidth = 0.8;
  outcomeCtx.beginPath(); outcomeCtx.moveTo(OC.l, OC.t+OC.ph); outcomeCtx.lineTo(OC.l+OC.pw, OC.t+OC.ph); outcomeCtx.stroke();
  const tickIncs = [20000, 50000, 100000, 200000, 500000, 1000000];
  tickIncs.forEach(inc => {
    const logI = Math.log10(inc);
    if (logI < LOG_INC_MIN || logI > LOG_INC_MAX) return;
    const x = OC.l + (logI-LOG_INC_MIN)/(LOG_INC_MAX-LOG_INC_MIN)*OC.pw;
    outcomeCtx.strokeStyle='#aab'; outcomeCtx.lineWidth=0.8;
    outcomeCtx.beginPath(); outcomeCtx.moveTo(x, OC.t+OC.ph); outcomeCtx.lineTo(x, OC.t+OC.ph+5); outcomeCtx.stroke();
    outcomeCtx.fillStyle='#7a8a'; outcomeCtx.font='10px Spectral,serif'; outcomeCtx.textAlign='center';
    outcomeCtx.fillText(formatDollars(inc), x, OC.t+OC.ph+17);
  });
  outcomeCtx.fillStyle='#556'; outcomeCtx.font='italic 12px Lato,sans-serif'; outcomeCtx.textAlign='center';
  const genLabel = state.gen === 0 ? 'Household Income (this generation)' : 'Child Household Income (next generation, with inheritance)';
  outcomeCtx.fillText(genLabel, OC.l+OC.pw/2, OC.H-4);

  // Legend
  [[sA.length,'A','rgba(139,58,30,0.55)'],[sB.length,'B','rgba(26,92,138,0.5)']].forEach(([n,key,col],i) => {
    const lx = OC.l + 8 + i*130;
    outcomeCtx.fillStyle=col; outcomeCtx.fillRect(lx, OC.t+4, 14, 11);
    outcomeCtx.fillStyle='#444'; outcomeCtx.font='10px Lato'; outcomeCtx.textAlign='left';
    outcomeCtx.fillText(`Set ${key} (n=${n})`, lx+18, OC.t+13);
  });
}

/* ================================================================
   SAMPLING ENGINE
   ================================================================ */
function sampleFromSet(key) {
  const s = state.sets[key];
  const r = s.traitRect;

  // Rejection-sample from bivariate normal within rectangle
  let iqZ, conscZ, tries = 0;
  do {
    iqZ    = randNormal();
    conscZ = iqZ * RHO_TRAITS + randNormal() * Math.sqrt(1 - RHO_TRAITS*RHO_TRAITS);
    tries++;
    if (tries > 500) {
      iqZ    = r.x0 + Math.random()*(r.x1-r.x0);
      conscZ = r.y0 + Math.random()*(r.y1-r.y0);
      break;
    }
  } while (iqZ < r.x0 || iqZ > r.x1 || conscZ < r.y0 || conscZ > r.y1);

  // Sample wealth percentile from bracket
  const wPct = s.wealthRange.lo + Math.random()*(s.wealthRange.hi - s.wealthRange.lo);
  const wealthLog = log10FromPctile(wPct);

  let hhIncome;
  if (state.gen === 0) {
    // THIS GENERATION: household = person + partner
    const personIncome = computeIndividualIncome(iqZ, conscZ, wealthLog);
    const partner = computePartner(iqZ, conscZ, wealthLog, state.am);
    const partnerIncome = computeIndividualIncome(partner.iqZ, partner.conscZ, partner.wealthLog);
    hhIncome = personIncome + partnerIncome;
    return { iqZ, conscZ, wealthLog, hhIncome, gen: 0 };
  } else {
    // NEXT GENERATION
    const personIncome = computeIndividualIncome(iqZ, conscZ, wealthLog);
    const partner = computePartner(iqZ, conscZ, wealthLog, state.am);
    const partnerIncome = computeIndividualIncome(partner.iqZ, partner.conscZ, partner.wealthLog);
    const hhIncomeParent = personIncome + partnerIncome;
    const child = computeChildGen(iqZ, conscZ, wealthLog, partner.iqZ, partner.conscZ, partner.wealthLog, hhIncomeParent);
    // Child's household income
    const childPartner = computePartner(child.iqZ, child.conscZ, child.wealthLog, state.am);
    const childIncome = computeIndividualIncome(child.iqZ, child.conscZ, child.wealthLog);
    const childPartnerIncome = computeIndividualIncome(childPartner.iqZ, childPartner.conscZ, childPartner.wealthLog);
    hhIncome = childIncome + childPartnerIncome;
    return { iqZ: child.iqZ, conscZ: child.conscZ, wealthLog: child.wealthLog, hhIncome, gen: 1 };
  }
}

let animFrame = null;
function animationTick() {
  if (!state.animating) return;
  const key = state.animTarget;
  const s = state.sets[key];
  for (let i = 0; i < ANIM_RATE; i++) {
    if (s.samples.length >= N_SAMPLES) { state.animating = false; break; }
    s.samples.push(sampleFromSet(key));
  }
  drawTraitPanel();
  drawWealthPanel();
  drawOutcomePanel();
  if (state.animating) animFrame = requestAnimationFrame(animationTick);
}

function startSampling() {
  if (state.animating) return;
  const key = state.active;
  state.sets[key].samples = [];
  state.animating = true;
  state.animTarget = key;
  cancelAnimationFrame(animFrame);
  animFrame = requestAnimationFrame(animationTick);
}

function clearSamples() {
  cancelAnimationFrame(animFrame);
  state.animating = false;
  state.sets.A.samples = [];
  state.sets.B.samples = [];
  ['a','b'].forEach(k => {
    ['med','iqr','p90'].forEach(m => { document.getElementById(`sim-stat-${k}-${m}`).textContent = '-'; });
  });
  document.getElementById('sim-stat-diff').textContent = '-';
  drawTraitPanel();
  drawWealthPanel();
  drawOutcomePanel();
}

/* ================================================================
   CONTROLS
   ================================================================ */
function setActive(key) {
  state.active = key;
  const tA = document.getElementById('sim-tab-A');
  const tB = document.getElementById('sim-tab-B');
  tA.style.background = key==='A' ? '#8b3a1e' : 'white';
  tA.style.color       = key==='A' ? 'white'   : '#8b3a1e';
  tB.style.background  = key==='B' ? '#1a5c8a' : 'white';
  tB.style.color       = key==='B' ? 'white'   : '#1a5c8a';
  drawTraitPanel();
  drawWealthPanel();
}

function onAMChange(val) {
  state.am = val / 100;
  document.getElementById('sim-am-val').textContent = state.am.toFixed(2);
}

function setGen(g) {
  state.gen = g;
  const g0 = document.getElementById('sim-gen0');
  const g1 = document.getElementById('sim-gen1');
  g0.style.background = g===0 ? '#1a1d1e' : 'white';
  g0.style.color       = g===0 ? 'white'   : '#6f777d';
  g1.style.background  = g===1 ? '#1a1d1e' : 'white';
  g1.style.color       = g===1 ? 'white'   : '#6f777d';
  clearSamples();
}

const PRESETS = {
  'iq-vs-wealth': {
    title: 'IQ vs Wealth - same expected income, different paths',
    A: { traitRect: {x0:1.0, y0:0.5, x1:2.5, y1:2.0}, wealthRange: {lo:0.40, hi:0.60} },
    B: { traitRect: {x0:-0.3, y0:-0.3, x1:0.8, y1:0.8}, wealthRange: {lo:0.80, hi:0.95} },
  },
  'dynasty': {
    title: 'Dynasty - top traits + bottom wealth vs average traits + top wealth',
    A: { traitRect: {x0:1.3, y0:1.0, x1:3.0, y1:3.0}, wealthRange: {lo:0.10, hi:0.30} },
    B: { traitRect: {x0:-0.5, y0:-0.5, x1:0.5, y1:0.5}, wealthRange: {lo:0.94, hi:0.99} },
  },
  'floor': {
    title: 'The Floor - identical traits, debt vs comfortable middle class',
    A: { traitRect: {x0:-0.3, y0:-0.3, x1:0.3, y1:0.3}, wealthRange: {lo:0.01, hi:0.15} },
    B: { traitRect: {x0:-0.3, y0:-0.3, x1:0.3, y1:0.3}, wealthRange: {lo:0.45, hi:0.60} },
  },
};

function loadPreset(key) {
  const p = PRESETS[key];
  state.sets.A.traitRect  = {...p.A.traitRect};
  state.sets.A.wealthRange = {...p.A.wealthRange};
  state.sets.B.traitRect  = {...p.B.traitRect};
  state.sets.B.wealthRange = {...p.B.wealthRange};
  clearSamples();
  const titleEl = document.getElementById('sim-outcome-title');
  if (titleEl) titleEl.textContent = p.title;
}

/* ================================================================
   CANVAS INTERACTION - TRAIT PANEL
   ================================================================ */
let traitDrag = null;
function traitCanvasCoords(e) {
  const rect = traitCanvas.getBoundingClientRect();
  const scaleX = TC.W / rect.width, scaleY = TC.H / rect.height;
  return [
    tInvX((e.clientX - rect.left) * scaleX),
    tInvY((e.clientY - rect.top)  * scaleY),
  ];
}
traitCanvas.addEventListener('mousedown', e => {
  const [x,y] = traitCanvasCoords(e);
  traitDrag = {x0:x, y0:y};
});
traitCanvas.addEventListener('mousemove', e => {
  if (!traitDrag) return;
  const [x,y] = traitCanvasCoords(e);
  const s = state.sets[state.active];
  s.traitRect = {
    x0: Math.min(traitDrag.x0, x), y0: Math.min(traitDrag.y0, y),
    x1: Math.max(traitDrag.x0, x), y1: Math.max(traitDrag.y0, y),
  };
  drawTraitPanel();
});
traitCanvas.addEventListener('mouseup', () => { traitDrag = null; });
traitCanvas.addEventListener('mouseleave', () => { traitDrag = null; });

// Touch
traitCanvas.addEventListener('touchstart', e => { e.preventDefault(); const t=e.touches[0]; traitDrag={...traitCanvasCoords(t).reduce((o,v,i)=>({...o,[['x0','y0'][i]]:v}),{})}; traitDrag = {x0: traitCanvasCoords(e.touches[0])[0], y0: traitCanvasCoords(e.touches[0])[1]}; }, {passive:false});
traitCanvas.addEventListener('touchmove', e => { e.preventDefault(); if(!traitDrag)return; const[x,y]=traitCanvasCoords(e.touches[0]); const s=state.sets[state.active]; s.traitRect={x0:Math.min(traitDrag.x0,x),y0:Math.min(traitDrag.y0,y),x1:Math.max(traitDrag.x0,x),y1:Math.max(traitDrag.y0,y)}; drawTraitPanel(); }, {passive:false});
traitCanvas.addEventListener('touchend', () => { traitDrag = null; });

/* ================================================================
   CANVAS INTERACTION - WEALTH PANEL
   ================================================================ */
let wealthDrag = null;
function wealthCanvasX(e) {
  const rect = wealthCanvas.getBoundingClientRect();
  return wInvX((e.clientX - rect.left) * WC.W / rect.width);
}
wealthCanvas.addEventListener('mousedown', e => {
  const lw = wealthCanvasX(e);
  const s = state.sets[state.active];
  const pct = pctileFromLog10(lw);
  // Check if near left or right handle to decide which side to drag
  const dLeft  = Math.abs(pct - s.wealthRange.lo);
  const dRight = Math.abs(pct - s.wealthRange.hi);
  wealthDrag = dLeft < dRight ? 'lo' : 'hi';
});
wealthCanvas.addEventListener('mousemove', e => {
  if (!wealthDrag) return;
  const lw  = wealthCanvasX(e);
  const pct = Math.max(0.01, Math.min(0.99, pctileFromLog10(lw)));
  const s   = state.sets[state.active];
  if (wealthDrag === 'lo') s.wealthRange.lo = Math.min(pct, s.wealthRange.hi - 0.02);
  else                      s.wealthRange.hi = Math.max(pct, s.wealthRange.lo + 0.02);
  drawWealthPanel();
});
wealthCanvas.addEventListener('mouseup', () => { wealthDrag = null; });
wealthCanvas.addEventListener('mouseleave', () => { wealthDrag = null; });

// Touch
wealthCanvas.addEventListener('touchstart', e => { e.preventDefault(); const lw=wealthCanvasX(e.touches[0]); const pct=pctileFromLog10(lw); const s=state.sets[state.active]; wealthDrag=Math.abs(pct-s.wealthRange.lo)<Math.abs(pct-s.wealthRange.hi)?'lo':'hi'; }, {passive:false});
wealthCanvas.addEventListener('touchmove', e => { e.preventDefault(); if(!wealthDrag)return; const lw=wealthCanvasX(e.touches[0]); const pct=Math.max(0.01,Math.min(0.99,pctileFromLog10(lw))); const s=state.sets[state.active]; if(wealthDrag==='lo')s.wealthRange.lo=Math.min(pct,s.wealthRange.hi-0.02); else s.wealthRange.hi=Math.max(pct,s.wealthRange.lo+0.02); drawWealthPanel(); }, {passive:false});
wealthCanvas.addEventListener('touchend', () => { wealthDrag = null; });

/* ================================================================
   INIT
   ================================================================ */
buildTraitCache();
buildWealthDensity();
drawTraitPanel();
drawWealthPanel();
drawOutcomePanel();
loadPreset('iq-vs-wealth');

/* Wire all controls via addEventListener - no global scope needed */
document.getElementById('sim-tab-A').addEventListener('click', () => setActive('A'));
document.getElementById('sim-tab-B').addEventListener('click', () => setActive('B'));
document.getElementById('sim-sample-btn').addEventListener('click', startSampling);
document.getElementById('sim-clear-btn').addEventListener('click', clearSamples);
document.getElementById('sim-preset-iq').addEventListener('click', () => loadPreset('iq-vs-wealth'));
document.getElementById('sim-preset-dynasty').addEventListener('click', () => loadPreset('dynasty'));
document.getElementById('sim-preset-floor').addEventListener('click', () => loadPreset('floor'));
document.getElementById('sim-am').addEventListener('input', e => onAMChange(e.target.value));
document.getElementById('sim-biq').addEventListener('input', e => onBIQChange(e.target.value));
document.getElementById('sim-gen0').addEventListener('click', () => setGen(0));
document.getElementById('sim-gen1').addEventListener('click', () => setGen(1));
})();


/* ============================================================
   FIGURE 2 (TLDR) - FAMILY DYNASTY SIMULATOR - injected below
   ============================================================ */
/* ============================================================
   FIGURE 7 - FAMILY DYNASTY SIMULATOR
   ============================================================ */
(function() {
'use strict';

/* ================================================================
   CONSTANTS & MODEL
   ================================================================ */
let   F7_B_IQ    = 0.35;
const F7_B_CONSC  = 0.25;
const F7_B_WEALTH = 0.45;
const F7_RESID_SD = 0.70;
const F7_RHO      = 0.25;
const F7_H2_IQ    = 0.60;
const F7_H2_CONSC = 0.45;
const F7_INC_MED  = 40000;
const F7_WEALTH_ACCUM = 20000;   // below: no compounding
const F7_WEALTH_DEBT  = 1000;    // below: debt erosion
const F7_IQ_SAVINGS   = 0.04;   // each SD IQ above mean → +4pp savings rate
const F7_INC_SD   = 0.90;
const F7_W_MEAN   = 5.20;
const F7_W_SD     = 1.05;
const F7_WT = [
  [0.00,1.0],[0.11,2.0],[0.20,3.70],[0.30,4.45],[0.40,4.92],
  [0.50,5.29],[0.60,5.53],[0.70,5.77],[0.80,6.00],
  [0.90,6.40],[0.95,6.71],[0.99,7.04],[1.00,7.70]
];
// Generation colour ramp: founders handled separately; gens 1-5 orange → dark grey
const F7_GCOLS = ['#607080','#e07530','#c07a38','#8a7048','#606060','#383838'];

/* ================================================================
   MATH UTILITIES
   ================================================================ */
let _f7spare = null;
function f7rn() {
  if (_f7spare !== null) { const v=_f7spare; _f7spare=null; return v; }
  let u,v,s;
  do { u=Math.random()*2-1; v=Math.random()*2-1; s=u*u+v*v; } while(s>=1||s===0);
  const m=Math.sqrt(-2*Math.log(s)/s); _f7spare=v*m; return u*m;
}
function f7wL(p) {
  p=Math.max(0.001,Math.min(0.999,p));
  for (let i=1;i<F7_WT.length;i++) {
    if (p<=F7_WT[i][0]) { const t=(p-F7_WT[i-1][0])/(F7_WT[i][0]-F7_WT[i-1][0]); return F7_WT[i-1][1]+t*(F7_WT[i][1]-F7_WT[i-1][1]); }
  }
  return F7_WT[F7_WT.length-1][1];
}
function f7wP(lw) {
  lw=Math.max(F7_WT[0][1],Math.min(F7_WT[F7_WT.length-1][1],lw));
  for (let i=1;i<F7_WT.length;i++) {
    if (lw<=F7_WT[i][1]) { const t=(lw-F7_WT[i-1][1])/(F7_WT[i][1]-F7_WT[i-1][1]); return F7_WT[i-1][0]+t*(F7_WT[i][0]-F7_WT[i-1][0]); }
  }
  return 1.0;
}
function f7wZ(lw) { return (lw-F7_W_MEAN)/F7_W_SD; }
function f7fmt(d) {
  if (d>=1e6) return '$'+(d/1e6).toFixed(1)+'M';
  if (d>=1e3) return '$'+Math.round(d/1000)+'k';
  return '$'+Math.round(d);
}
function f7hex2rgb(h) {
  return parseInt(h.slice(1,3),16)+','+parseInt(h.slice(3,5),16)+','+parseInt(h.slice(5,7),16);
}

/* ================================================================
   INCOME & REPRODUCTION MODEL
   ================================================================ */
function f7inc(iqZ,conscZ,wLog) {
  // Expected income (no residual noise) - variance comes from trait inheritance, not income noise
  return F7_INC_MED*Math.exp((F7_B_IQ*iqZ+F7_B_CONSC*conscZ+F7_B_WEALTH*f7wZ(wLog))*F7_INC_SD);
}
function f7part(iqZ,conscZ,wLog,am) {
  const sq=Math.sqrt(Math.max(0,1-am*am));
  return { iqZ:am*iqZ+sq*f7rn(), conscZ:am*conscZ+sq*f7rn(), wealthLog:F7_W_MEAN+(am*f7wZ(wLog)+sq*f7rn())*F7_W_SD };
}
function f7childOf(p1,p2,hhInc) {
  const mIQ=(p1.iqZ+p2.iqZ)/2, mC=(p1.conscZ+p2.conscZ)/2;
  const cIQ   =mIQ *Math.sqrt(F7_H2_IQ)   +f7rn()*Math.sqrt(1-F7_H2_IQ/2);
  const cConsc=mC  *Math.sqrt(F7_H2_CONSC)+f7rn()*Math.sqrt(1-F7_H2_CONSC/2);
  // Wealth: threshold-gated compounding + IQ-adjusted savings
  // Dynasty heir inherits primarily from dynasty lineage (p1), minority from partner (p2)
  const avgW = Math.pow(10,p1.wealthLog)*0.75 + Math.pow(10,p2.wealthLog)*0.25;
  const avgIQ = p1.iqZ*0.75 + p2.iqZ*0.25;

  // Capital growth is threshold-gated
  const wGrow = avgW < F7_WEALTH_DEBT  ? 0.85
              : avgW < F7_WEALTH_ACCUM ? 1.0
              :                          1.5;

  // Savings rate is IQ-adjusted but only activates above accumulation threshold
  const sRate = avgW >= F7_WEALTH_ACCUM
    ? Math.max(0, 0.12 + F7_IQ_SAVINGS * avgIQ)
    : 0;

  const childW = 0.85 * avgW * wGrow + 0.15 * hhInc * 40 * sRate;
  return { iqZ:cIQ, conscZ:cConsc, wealthLog:Math.log10(Math.max(100,childW)) };
}

/* ================================================================
   STATE
   ================================================================ */
const f7={
  active:'A',
  founders:{ A:{iqZ:1.2,conscZ:0.8,wealthLog:5.8}, B:{iqZ:-0.2,conscZ:-0.1,wealthLog:6.2} },
  am:0.70, kids:2,
  generations:[], simDone:false,
  displayedGens:0, animating:false
};

/* ================================================================
   TRAIT CANVAS
   ================================================================ */
const f7TC=document.getElementById('f7-trait-canvas');
const f7tC=f7TC.getContext('2d');
const FT={W:500,H:380,l:55,t:20,r:20,b:45};
FT.pw=FT.W-FT.l-FT.r; FT.ph=FT.H-FT.t-FT.b;
const FT_ZMIN=-3.5, FT_ZMAX=3.5;
const f7tX=z=>FT.l+(z-FT_ZMIN)/(FT_ZMAX-FT_ZMIN)*FT.pw;
const f7tY=z=>FT.t+(1-(z-FT_ZMIN)/(FT_ZMAX-FT_ZMIN))*FT.ph;
const f7tInvX=px=>FT_ZMIN+(px-FT.l)/FT.pw*(FT_ZMAX-FT_ZMIN);
const f7tInvY=py=>FT_ZMAX-(py-FT.t)/FT.ph*(FT_ZMAX-FT_ZMIN);

let f7TCache=null;
function f7buildTCache() {
  const img=f7tC.createImageData(FT.W,FT.H); const d=img.data;
  const rho=F7_RHO, denom=2*(1-rho*rho);
  for (let py=0;py<FT.H;py++) for (let px=0;px<FT.W;px++) {
    const idx=(py*FT.W+px)*4;
    if (px<FT.l||px>FT.l+FT.pw||py<FT.t||py>FT.t+FT.ph) { d[idx]=250;d[idx+1]=250;d[idx+2]=250;d[idx+3]=255; continue; }
    const x=f7tInvX(px),y=f7tInvY(py);
    const q=(x*x-2*rho*x*y+y*y)/denom;
    const maxQ=0; // PDF at origin = 1/(2π√(1-ρ²))
    const pdf=Math.exp(-q); // unnormalised
    const t=Math.pow(pdf, 0.45);
    d[idx]=Math.round(235+(90-235)*t); d[idx+1]=Math.round(240+(165-240)*t);
    d[idx+2]=Math.round(250+(220-250)*t); d[idx+3]=255;
  }
  f7TCache=img;
}

function f7drawTrait() {
  if (!f7TCache) f7buildTCache();
  f7tC.putImageData(f7TCache,0,0);
  // Grid
  f7tC.strokeStyle='#cce'; f7tC.lineWidth=0.4;
  for (let v=-3;v<=3;v++) { if(v===0)continue; const cx=f7tX(v),cy=f7tY(v);
    f7tC.beginPath();f7tC.moveTo(cx,FT.t);f7tC.lineTo(cx,FT.t+FT.ph);f7tC.stroke();
    f7tC.beginPath();f7tC.moveTo(FT.l,cy);f7tC.lineTo(FT.l+FT.pw,cy);f7tC.stroke(); }
  // Axes
  f7tC.strokeStyle='#aab'; f7tC.lineWidth=0.8;
  f7tC.beginPath();f7tC.moveTo(FT.l,FT.t);f7tC.lineTo(FT.l,FT.t+FT.ph);f7tC.stroke();
  f7tC.beginPath();f7tC.moveTo(FT.l,FT.t+FT.ph);f7tC.lineTo(FT.l+FT.pw,FT.t+FT.ph);f7tC.stroke();
  // Tick labels
  f7tC.fillStyle='#8a9'; f7tC.font='11px Spectral,serif'; f7tC.textAlign='center';
  for (let v=-3;v<=3;v++) { if(v===0)continue;
    f7tC.fillText(v+'σ',f7tX(v),FT.t+FT.ph+14);
    f7tC.textAlign='right'; f7tC.fillText(v+'σ',FT.l-5,f7tY(v)+4); f7tC.textAlign='center'; }
  f7tC.fillStyle='#556'; f7tC.font='italic 10px Spectral,serif';
  [-2,-1,0,1,2].forEach(v=>f7tC.fillText('IQ '+(100+v*15),f7tX(v),FT.t+FT.ph+26));
  f7tC.fillStyle='#556'; f7tC.font='italic 12px Lato,sans-serif'; f7tC.textAlign='center';
  f7tC.fillText('IQ (z-score)',FT.l+FT.pw/2,FT.H-3);
  f7tC.save(); f7tC.translate(13,FT.t+FT.ph/2); f7tC.rotate(-Math.PI/2);
  f7tC.fillText('Conscientiousness',0,0); f7tC.restore();
  // Descendant dots (gens 1-5, max 60 per gen, smaller radius)
  for (let g=1;g<=5&&g<f7.generations.length&&g<f7.displayedGens;g++) {
    const gen=f7.generations[g]; const col=F7_GCOLS[g];
    const step=gen.length>60?Math.ceil(gen.length/60):1;
    gen.forEach((p,i)=>{ if(i%step!==0)return;
      const x=f7tX(p.iqZ),y=f7tY(p.conscZ);
      if(x<FT.l||x>FT.l+FT.pw||y<FT.t||y>FT.t+FT.ph)return;
      f7tC.beginPath(); f7tC.arc(x,y,3,0,2*Math.PI);
      f7tC.fillStyle='rgba('+f7hex2rgb(col)+',0.7)'; f7tC.fill(); });
  }
  // Founders on top
  [['A','#8b3a1e'],['B','#1a5c8a']].forEach(([key,col])=>{
    const p=f7.founders[key]; const x=f7tX(p.iqZ),y=f7tY(p.conscZ);
    f7tC.beginPath(); f7tC.arc(x,y,9,0,2*Math.PI);
    f7tC.fillStyle=col; f7tC.fill();
    f7tC.strokeStyle=f7.active===key?'white':'rgba(255,255,255,0.5)';
    f7tC.lineWidth=2; f7tC.stroke();
    f7tC.fillStyle='white'; f7tC.font='bold 10px Lato,sans-serif'; f7tC.textAlign='center';
    f7tC.fillText(key,x,y+4); });
  // Legend
  const litems=f7.simDone
    ? [['A','#8b3a1e'],['B','#1a5c8a'],...GEN_LABELS.slice(1,f7.displayedGens).map((lbl,i)=>[lbl,GEN_ROW_COLS[i+1]])]
    : [['Founder A','#8b3a1e'],['Founder B','#1a5c8a']];
  const lx=FT.l+4, ly=FT.t+4;
  f7tC.fillStyle='rgba(255,255,255,0.88)'; f7tC.fillRect(lx,ly,82,litems.length*14+6);
  litems.forEach(([lbl,col],i)=>{
    const y=ly+6+i*14;
    f7tC.fillStyle=col; f7tC.beginPath(); f7tC.arc(lx+6,y+4,4,0,2*Math.PI); f7tC.fill();
    f7tC.fillStyle='#333'; f7tC.font='9px Lato,sans-serif'; f7tC.textAlign='left';
    f7tC.fillText(lbl,lx+14,y+8); });
}

/* ================================================================
   WEALTH CANVAS
   ================================================================ */
const f7WC=document.getElementById('f7-wealth-canvas');
const f7wCtx=f7WC.getContext('2d');
const FW={W:500,H:380,l:55,t:20,r:20,b:45};
FW.pw=FW.W-FW.l-FW.r; FW.ph=FW.H-FW.t-FW.b;
const FW_LMIN=1.5, FW_LMAX=7.8;
const f7wX=lw=>FW.l+(lw-FW_LMIN)/(FW_LMAX-FW_LMIN)*FW.pw;
const f7wInvX=px=>FW_LMIN+(px-FW.l)/FW.pw*(FW_LMAX-FW_LMIN);

let f7WDens=null;
function f7buildWDens() {
  const N=300,pts=[]; let maxD=0;
  for (let i=0;i<=N;i++) {
    const lw=FW_LMIN+(FW_LMAX-FW_LMIN)*i/N;
    const d=(f7wP(lw+0.06)-f7wP(lw-0.06))/0.12;
    pts.push([lw,d]); if(d>maxD)maxD=d;
  }
  f7WDens={pts,maxD};
}

function f7drawWealth() {
  if (!f7WDens) f7buildWDens();
  const {pts,maxD}=f7WDens;
  f7wCtx.clearRect(0,0,FW.W,FW.H); f7wCtx.fillStyle='#f9f9f8'; f7wCtx.fillRect(0,0,FW.W,FW.H);
  // Grid
  for (let e=2;e<=7;e++) { const x=f7wX(e);
    f7wCtx.strokeStyle='#e0e8e0'; f7wCtx.lineWidth=0.5;
    f7wCtx.beginPath();f7wCtx.moveTo(x,FW.t);f7wCtx.lineTo(x,FW.t+FW.ph);f7wCtx.stroke(); }
  // Axes
  f7wCtx.strokeStyle='#aab'; f7wCtx.lineWidth=0.8;
  f7wCtx.beginPath();f7wCtx.moveTo(FW.l,FW.t);f7wCtx.lineTo(FW.l,FW.t+FW.ph);f7wCtx.stroke();
  f7wCtx.beginPath();f7wCtx.moveTo(FW.l,FW.t+FW.ph);f7wCtx.lineTo(FW.l+FW.pw,FW.t+FW.ph);f7wCtx.stroke();
  // Density fill
  f7wCtx.beginPath(); f7wCtx.moveTo(f7wX(FW_LMIN),FW.t+FW.ph);
  pts.forEach(([lw,d])=>f7wCtx.lineTo(f7wX(lw),FW.t+FW.ph-(d/maxD)*FW.ph*0.88));
  f7wCtx.lineTo(f7wX(FW_LMAX),FW.t+FW.ph); f7wCtx.closePath();
  f7wCtx.fillStyle='rgba(100,140,100,0.12)'; f7wCtx.fill();
  f7wCtx.strokeStyle='#5a8a5a'; f7wCtx.lineWidth=1.5;
  f7wCtx.beginPath();
  pts.forEach(([lw,d],i)=>{ const px=f7wX(lw),py=FW.t+FW.ph-(d/maxD)*FW.ph*0.88; i===0?f7wCtx.moveTo(px,py):f7wCtx.lineTo(px,py); });
  f7wCtx.stroke();
  // Descendant ticks (gens 1-5)
  for (let g=1;g<=5&&g<f7.generations.length&&g<f7.displayedGens;g++) {
    const gen=f7.generations[g]; const col=F7_GCOLS[g];
    const step=gen.length>60?Math.ceil(gen.length/60):1;
    const midY=FW.t+FW.ph/2;
    gen.forEach((p,i)=>{ if(i%step!==0)return;
      const x=f7wX(p.wealthLog);
      f7wCtx.strokeStyle='rgba('+f7hex2rgb(col)+',0.6)'; f7wCtx.lineWidth=1.5;
      f7wCtx.beginPath(); f7wCtx.moveTo(x,midY-10+(i%5)*4); f7wCtx.lineTo(x,midY+10+(i%5)*4); f7wCtx.stroke(); }); }
  // X labels
  const xlbls={2:'$100',3:'$1k',4:'$10k',5:'$100k',6:'$1M',7:'$10M'};
  f7wCtx.fillStyle='#556'; f7wCtx.font='10px Spectral,serif'; f7wCtx.textAlign='center';
  for (let e=2;e<=7;e++) f7wCtx.fillText(xlbls[e],f7wX(e),FW.t+FW.ph+16);
  f7wCtx.fillStyle='#556'; f7wCtx.font='italic 12px Lato,sans-serif';
  f7wCtx.fillText('Starting Net Worth (log scale)',FW.l+FW.pw/2,FW.H-3);
  // Reference lines
  [{v:5.29,label:'Median',col:'#888'},{v:Math.log10(1060000),label:'Mean',col:'#5a8'}].forEach(({v,label,col})=>{
    const x=f7wX(v); f7wCtx.strokeStyle=col; f7wCtx.lineWidth=1; f7wCtx.setLineDash([3,3]);
    f7wCtx.beginPath();f7wCtx.moveTo(x,FW.t);f7wCtx.lineTo(x,FW.t+FW.ph);f7wCtx.stroke();
    f7wCtx.setLineDash([]);
    f7wCtx.fillStyle=col; f7wCtx.font='8.5px Spectral,serif'; f7wCtx.textAlign='left';
    f7wCtx.fillText(label,x+3,FW.t+FW.ph-6); });
  // Founder tick marks
  [['A','#8b3a1e'],['B','#1a5c8a']].forEach(([key,col])=>{
    const p=f7.founders[key]; const x=f7wX(p.wealthLog);
    f7wCtx.strokeStyle=col; f7wCtx.lineWidth=f7.active===key?3:2;
    f7wCtx.beginPath(); f7wCtx.moveTo(x,FW.t+8); f7wCtx.lineTo(x,FW.t+FW.ph-8); f7wCtx.stroke();
    // Triangle handle
    f7wCtx.fillStyle=col; f7wCtx.beginPath();
    f7wCtx.moveTo(x-7,FW.t+8); f7wCtx.lineTo(x+7,FW.t+8); f7wCtx.lineTo(x,FW.t+20); f7wCtx.closePath(); f7wCtx.fill();
    f7wCtx.fillStyle='white'; f7wCtx.font='bold 9px Lato,sans-serif'; f7wCtx.textAlign='center';
    f7wCtx.fillText(key,x,FW.t+17);
    f7wCtx.fillStyle=col; f7wCtx.font='8px Spectral,serif';
    f7wCtx.fillText(f7fmt(Math.pow(10,p.wealthLog)),x,FW.t+FW.ph-12); });
}

/* ================================================================
   JOY-PLOT (RIDGELINE) CANVAS - INCOME
   ================================================================ */
const f7GC=document.getElementById('f7-gen-canvas');
const f7gCtx=f7GC.getContext('2d');
const FG={W:960,H:300,l:90,t:15,r:20,b:42};
FG.pw=FG.W-FG.l-FG.r; FG.ph=FG.H-FG.t-FG.b;
const FG_LMIN=Math.log10(15000), FG_LMAX=Math.log10(2000000);
const N_ROWS=6, ROW_H=FG.ph/N_ROWS;
const f7gX=inc=>FG.l+(Math.log10(Math.max(1,inc))-FG_LMIN)/(FG_LMAX-FG_LMIN)*FG.pw;
const GEN_LABELS=['Founders','Gen 1','Gen 2','Gen 3','Gen 4','Gen 5'];
const GEN_ROW_COLS=['#8b3a1e',...F7_GCOLS.slice(1)];

function f7kde(incomes,logX) {
  if (!incomes.length) return 0;
  const h=0.14; let d=0;
  incomes.forEach(inc=>{ const z=(logX-Math.log10(Math.max(1,inc)))/h; d+=Math.exp(-0.5*z*z); });
  return d/(incomes.length*h*Math.sqrt(2*Math.PI));
}

function f7drawJoy() {
  f7gCtx.clearRect(0,0,FG.W,FG.H);
  f7gCtx.fillStyle='#fafaf8'; f7gCtx.fillRect(0,0,FG.W,FG.H);
  if (!f7.simDone) {
    f7gCtx.fillStyle='#aab'; f7gCtx.font='italic 14px Spectral,serif'; f7gCtx.textAlign='center';
    f7gCtx.fillText('Click ▶ Simulate to project the family dynasty across five generations',FG.W/2,FG.H/2);
    return;
  }
  // Vertical reference lines
  [20000,50000,100000,200000,500000,1000000].forEach(inc=>{
    const x=f7gX(inc); if(x<FG.l||x>FG.l+FG.pw)return;
    f7gCtx.strokeStyle='rgba(180,180,180,0.35)'; f7gCtx.lineWidth=0.5; f7gCtx.setLineDash([3,3]);
    f7gCtx.beginPath();f7gCtx.moveTo(x,FG.t);f7gCtx.lineTo(x,FG.t+FG.ph);f7gCtx.stroke();
    f7gCtx.setLineDash([]); });
  // US median
  const medX=f7gX(74580);
  f7gCtx.strokeStyle='rgba(100,100,100,0.2)'; f7gCtx.lineWidth=1; f7gCtx.setLineDash([4,3]);
  f7gCtx.beginPath();f7gCtx.moveTo(medX,FG.t);f7gCtx.lineTo(medX,FG.t+FG.ph);f7gCtx.stroke();
  f7gCtx.setLineDash([]);
  f7gCtx.fillStyle='rgba(120,120,120,0.5)'; f7gCtx.font='8px Spectral,serif'; f7gCtx.textAlign='center';
  f7gCtx.fillText('US median',medX,FG.t+7);
  // Build KDE per generation
  const N_KDE=200;
  const kdeData=f7.generations.map(gen=>{
    const incomes=gen.map(p=>p.hhIncome).filter(v=>v>0);
    const pts=[]; let maxD=0;
    for (let i=0;i<=N_KDE;i++) {
      const logX=FG_LMIN+(FG_LMAX-FG_LMIN)*i/N_KDE;
      const d=f7kde(incomes,logX); pts.push(d); if(d>maxD)maxD=d; }
    return {pts,incomes,maxD};
  });
  // Draw rows
  for (let g=0;g<N_ROWS;g++) {
    const rowY=FG.t+g*ROW_H; const col=GEN_ROW_COLS[g];
    // Subtle alternating bg
    if(g%2===0){f7gCtx.fillStyle='rgba(0,0,0,0.018)';f7gCtx.fillRect(FG.l,rowY,FG.pw,ROW_H);}
    // Row label
    f7gCtx.fillStyle=col; f7gCtx.font='bold 10px Lato,sans-serif'; f7gCtx.textAlign='right';
    f7gCtx.fillText(GEN_LABELS[g],FG.l-6,rowY+ROW_H/2+4);
    // Row separator
    f7gCtx.strokeStyle='rgba(180,180,180,0.3)'; f7gCtx.lineWidth=0.5;
    f7gCtx.beginPath();f7gCtx.moveTo(FG.l,rowY+ROW_H);f7gCtx.lineTo(FG.l+FG.pw,rowY+ROW_H);f7gCtx.stroke();
    if (g>=f7.generations.length||g>=f7.displayedGens) continue;
    const {pts,incomes,maxD}=kdeData[g]; if(!maxD) continue;
    const scaleH=ROW_H*0.88;
    // Filled area
    f7gCtx.beginPath(); f7gCtx.moveTo(FG.l,rowY+ROW_H);
    for (let i=0;i<=N_KDE;i++) {
      const x=FG.l+i/N_KDE*FG.pw; const y=rowY+ROW_H-(pts[i]/maxD)*scaleH; f7gCtx.lineTo(x,y); }
    f7gCtx.lineTo(FG.l+FG.pw,rowY+ROW_H); f7gCtx.closePath();
    f7gCtx.fillStyle='rgba('+f7hex2rgb(col)+',0.22)'; f7gCtx.fill();
    // Outline
    f7gCtx.beginPath();
    for (let i=0;i<=N_KDE;i++) {
      const x=FG.l+i/N_KDE*FG.pw; const y=rowY+ROW_H-(pts[i]/maxD)*scaleH;
      i===0?f7gCtx.moveTo(x,y):f7gCtx.lineTo(x,y); }
    f7gCtx.strokeStyle=col; f7gCtx.lineWidth=1.5; f7gCtx.stroke();
    // Median line
    const sorted=[...incomes].sort((a,b)=>a-b); const med=sorted[Math.floor(sorted.length/2)];
    const mx=f7gX(med);
    f7gCtx.strokeStyle=col; f7gCtx.lineWidth=2;
    f7gCtx.beginPath();f7gCtx.moveTo(mx,rowY+4);f7gCtx.lineTo(mx,rowY+ROW_H-2);f7gCtx.stroke();
    // Median label (keep in bounds)
    const lx=Math.min(Math.max(mx,FG.l+22),FG.l+FG.pw-22);
    f7gCtx.fillStyle=col; f7gCtx.font='bold 9px Lato,sans-serif'; f7gCtx.textAlign='center';
    f7gCtx.fillText(f7fmt(med),lx,rowY+11);
  }
  // X-axis
  f7gCtx.strokeStyle='#aab'; f7gCtx.lineWidth=0.8;
  f7gCtx.beginPath();f7gCtx.moveTo(FG.l,FG.t+FG.ph);f7gCtx.lineTo(FG.l+FG.pw,FG.t+FG.ph);f7gCtx.stroke();
  [20000,50000,100000,200000,500000,1000000].forEach(inc=>{
    const logI=Math.log10(inc);
    if (logI<FG_LMIN||logI>FG_LMAX) return;
    const x=FG.l+(logI-FG_LMIN)/(FG_LMAX-FG_LMIN)*FG.pw;
    f7gCtx.strokeStyle='#aab'; f7gCtx.lineWidth=0.8;
    f7gCtx.beginPath();f7gCtx.moveTo(x,FG.t+FG.ph);f7gCtx.lineTo(x,FG.t+FG.ph+5);f7gCtx.stroke();
    f7gCtx.fillStyle='#888'; f7gCtx.font='10px Spectral,serif'; f7gCtx.textAlign='center';
    f7gCtx.fillText(f7fmt(inc),x,FG.t+FG.ph+17); });
  f7gCtx.fillStyle='#556'; f7gCtx.font='italic 11px Lato,sans-serif'; f7gCtx.textAlign='center';
  f7gCtx.fillText('Household Income (log scale)',FG.l+FG.pw/2,FG.H-5);
}

/* ================================================================
   SIMULATION
   ================================================================ */
function f7simulate() {
  f7.generations=[]; f7.simDone=false;
  const fa={...f7.founders.A}; const fb={...f7.founders.B};
  fa.hhIncome=f7inc(fa.iqZ,fa.conscZ,fa.wealthLog);
  fb.hhIncome=f7inc(fb.iqZ,fb.conscZ,fb.wealthLog);
  f7.generations.push([fa,fb]);
  // Gen 1: founders as a couple
  const g1=[]; const nK1=Math.max(1,Math.min(5,Math.round(f7.kids+f7rn()*0.5)));
  const hh0=(fa.hhIncome+fb.hhIncome)/2;
  for (let k=0;k<nK1;k++) { const c=f7childOf(fa,fb,hh0); c.hhIncome=f7inc(c.iqZ,c.conscZ,c.wealthLog); g1.push(c); }
  f7.generations.push(g1);
  // Gen 2-5: each person finds an assortative partner
  for (let g=2;g<=5;g++) {
    const prev=f7.generations[g-1]; const next=[];
    // Limit parents to avoid explosion (max 80 parents → max 80*5=400 children, capped at 200)
    const parents=prev.length>80?Array.from({length:80},(_,i)=>prev[Math.floor(i*prev.length/80)]):prev;
    parents.forEach(p=>{
      const partner=f7part(p.iqZ,p.conscZ,p.wealthLog,f7.am);
      partner.hhIncome=f7inc(partner.iqZ,partner.conscZ,partner.wealthLog);
      const hh=(p.hhIncome+partner.hhIncome)/2;
      const nK=Math.max(1,Math.min(5,Math.round(f7.kids+f7rn()*0.5)));
      for (let k=0;k<nK;k++) { const c=f7childOf(p,partner,hh); c.hhIncome=f7inc(c.iqZ,c.conscZ,c.wealthLog); next.push(c); } });
    // Cap generation size
    f7.generations.push(next.length>200?Array.from({length:200},(_,i)=>next[Math.floor(i*next.length/200)]):next);
  }
  f7.simDone=true;
}

function f7animateReveal() {
  if (f7.displayedGens>=f7.generations.length) { f7.animating=false; return; }
  f7.displayedGens++;
  f7drawTrait(); f7drawWealth(); f7drawJoy(); f7drawWealthJoy(); f7updateStats();
  if (f7.displayedGens<f7.generations.length) setTimeout(f7animateReveal,800);
  else f7.animating=false;
}

/* ================================================================
   JOY-PLOT - WEALTH
   ================================================================ */
const f7WGC=document.getElementById('f7-wealth-joy-canvas');
const f7wgCtx=f7WGC.getContext('2d');
const FGW={W:960,H:300,l:90,t:15,r:20,b:42};
FGW.pw=FGW.W-FGW.l-FGW.r; FGW.ph=FGW.H-FGW.t-FGW.b;
// Wealth range matches the wealth positioning canvas
const FGW_LMIN=1.5, FGW_LMAX=7.8;
const f7gwX=lw=>FGW.l+(lw-FGW_LMIN)/(FGW_LMAX-FGW_LMIN)*FGW.pw;

function f7wkde(wLogs,logX) {
  if (!wLogs.length) return 0;
  const h=0.18; let d=0;
  wLogs.forEach(lw=>{ const z=(logX-lw)/h; d+=Math.exp(-0.5*z*z); });
  return d/(wLogs.length*h*Math.sqrt(2*Math.PI));
}

function f7drawWealthJoy() {
  f7wgCtx.clearRect(0,0,FGW.W,FGW.H);
  f7wgCtx.fillStyle='#fafaf8'; f7wgCtx.fillRect(0,0,FGW.W,FGW.H);
  if (!f7.simDone) {
    f7wgCtx.fillStyle='#aab'; f7wgCtx.font='italic 14px Spectral,serif'; f7wgCtx.textAlign='center';
    f7wgCtx.fillText('Click ▶ Simulate to see wealth trajectories across five generations',FGW.W/2,FGW.H/2);
    return;
  }
  // Reference lines
  [{v:5.29,label:'Population median $193k',col:'rgba(100,100,100,0.25)'},{v:Math.log10(1060000),label:'Mean $1.06M',col:'rgba(90,138,90,0.25)'}].forEach(({v,label,col})=>{
    const x=f7gwX(v); f7wgCtx.strokeStyle=col; f7wgCtx.lineWidth=1; f7wgCtx.setLineDash([4,3]);
    f7wgCtx.beginPath();f7wgCtx.moveTo(x,FGW.t);f7wgCtx.lineTo(x,FGW.t+FGW.ph);f7wgCtx.stroke();
    f7wgCtx.setLineDash([]);
    f7wgCtx.fillStyle=col; f7wgCtx.font='8px Spectral,serif'; f7wgCtx.textAlign='center';
    f7wgCtx.fillText(label,x,FGW.t+6); });
  // Vertical grid
  for (let e=2;e<=7;e++) {
    const x=f7gwX(e); f7wgCtx.strokeStyle='rgba(180,180,180,0.25)'; f7wgCtx.lineWidth=0.5; f7wgCtx.setLineDash([3,3]);
    f7wgCtx.beginPath();f7wgCtx.moveTo(x,FGW.t);f7wgCtx.lineTo(x,FGW.t+FGW.ph);f7wgCtx.stroke();
    f7wgCtx.setLineDash([]); }
  // Build KDE per generation
  const N_KDE=200;
  const kdeData=f7.generations.map(gen=>{
    const wLogs=gen.map(p=>p.wealthLog);
    const pts=[]; let maxD=0;
    for (let i=0;i<=N_KDE;i++) {
      const lx=FGW_LMIN+(FGW_LMAX-FGW_LMIN)*i/N_KDE;
      const d=f7wkde(wLogs,lx); pts.push(d); if(d>maxD)maxD=d; }
    return {pts,wLogs,maxD};
  });
  const WG_ROW_H=FGW.ph/N_ROWS;
  // Draw rows
  for (let g=0;g<N_ROWS;g++) {
    const rowY=FGW.t+g*WG_ROW_H; const col=GEN_ROW_COLS[g];
    if(g%2===0){f7wgCtx.fillStyle='rgba(0,0,0,0.018)';f7wgCtx.fillRect(FGW.l,rowY,FGW.pw,WG_ROW_H);}
    f7wgCtx.fillStyle=col; f7wgCtx.font='bold 10px Lato,sans-serif'; f7wgCtx.textAlign='right';
    f7wgCtx.fillText(GEN_LABELS[g],FGW.l-6,rowY+WG_ROW_H/2+4);
    f7wgCtx.strokeStyle='rgba(180,180,180,0.3)'; f7wgCtx.lineWidth=0.5;
    f7wgCtx.beginPath();f7wgCtx.moveTo(FGW.l,rowY+WG_ROW_H);f7wgCtx.lineTo(FGW.l+FGW.pw,rowY+WG_ROW_H);f7wgCtx.stroke();
    if (g>=f7.generations.length||g>=f7.displayedGens) continue;
    const {pts,wLogs,maxD}=kdeData[g]; if(!maxD) continue;
    const scaleH=WG_ROW_H*0.88;
    // Filled area
    f7wgCtx.beginPath(); f7wgCtx.moveTo(FGW.l,rowY+WG_ROW_H);
    for (let i=0;i<=N_KDE;i++) {
      const x=FGW.l+i/N_KDE*FGW.pw; const y=rowY+WG_ROW_H-(pts[i]/maxD)*scaleH; f7wgCtx.lineTo(x,y); }
    f7wgCtx.lineTo(FGW.l+FGW.pw,rowY+WG_ROW_H); f7wgCtx.closePath();
    f7wgCtx.fillStyle='rgba('+f7hex2rgb(col)+',0.22)'; f7wgCtx.fill();
    // Outline
    f7wgCtx.beginPath();
    for (let i=0;i<=N_KDE;i++) {
      const x=FGW.l+i/N_KDE*FGW.pw; const y=rowY+WG_ROW_H-(pts[i]/maxD)*scaleH;
      i===0?f7wgCtx.moveTo(x,y):f7wgCtx.lineTo(x,y); }
    f7wgCtx.strokeStyle=col; f7wgCtx.lineWidth=1.5; f7wgCtx.stroke();
    // Median line
    const sorted=[...wLogs].sort((a,b)=>a-b); const medLog=sorted[Math.floor(sorted.length/2)];
    const mx=f7gwX(medLog);
    f7wgCtx.strokeStyle=col; f7wgCtx.lineWidth=2;
    f7wgCtx.beginPath();f7wgCtx.moveTo(mx,rowY+4);f7wgCtx.lineTo(mx,rowY+WG_ROW_H-2);f7wgCtx.stroke();
    const lx2=Math.min(Math.max(mx,FGW.l+22),FGW.l+FGW.pw-22);
    f7wgCtx.fillStyle=col; f7wgCtx.font='bold 9px Lato,sans-serif'; f7wgCtx.textAlign='center';
    f7wgCtx.fillText(f7fmt(Math.pow(10,medLog)),lx2,rowY+11);
  }
  // X-axis
  f7wgCtx.strokeStyle='#aab'; f7wgCtx.lineWidth=0.8;
  f7wgCtx.beginPath();f7wgCtx.moveTo(FGW.l,FGW.t+FGW.ph);f7wgCtx.lineTo(FGW.l+FGW.pw,FGW.t+FGW.ph);f7wgCtx.stroke();
  const xlbls={2:'$100',3:'$1k',4:'$10k',5:'$100k',6:'$1M',7:'$10M'};
  for (let e=2;e<=7;e++) {
    const x=f7gwX(e);
    f7wgCtx.strokeStyle='#aab'; f7wgCtx.lineWidth=0.8;
    f7wgCtx.beginPath();f7wgCtx.moveTo(x,FGW.t+FGW.ph);f7wgCtx.lineTo(x,FGW.t+FGW.ph+5);f7wgCtx.stroke();
    f7wgCtx.fillStyle='#888'; f7wgCtx.font='10px Spectral,serif'; f7wgCtx.textAlign='center';
    f7wgCtx.fillText(xlbls[e],x,FGW.t+FGW.ph+17); }
  f7wgCtx.fillStyle='#556'; f7wgCtx.font='italic 11px Lato,sans-serif'; f7wgCtx.textAlign='center';
  f7wgCtx.fillText('Net Worth (log scale)',FGW.l+FGW.pw/2,FGW.H-5);
}

/* ================================================================
   STATS TABLE
   ================================================================ */
function f7updateStats() {
  const tbody=document.getElementById('f7-stats-body');
  if (!f7.simDone) { tbody.innerHTML='<tr><td colspan="5" style="text-align:center;color:#aab;padding:0.6rem;font-style:italic;">Run the simulation to see results</td></tr>'; return; }
  const labels=['Founders','Gen 1 (children)','Gen 2','Gen 3','Gen 4','Gen 5'];
  let html='';
  f7.generations.slice(0,f7.displayedGens).forEach((gen,g)=>{
    const incs=[...gen.map(p=>p.hhIncome)].sort((a,b)=>a-b);
    const ws=[...gen.map(p=>Math.pow(10,p.wealthLog))].sort((a,b)=>a-b);
    const avgIQ=gen.reduce((s,p)=>s+p.iqZ,0)/gen.length;
    const avgIQpts=Math.round(100+avgIQ*15);
    const medInc=incs[Math.floor(incs.length/2)], medW=ws[Math.floor(ws.length/2)];
    const col=g===0?'#8b3a1e':GEN_ROW_COLS[g];
    html+=`<tr style="border-bottom:1px solid #eee;">
      <td style="padding:0.3rem 0.6rem;color:${col};font-weight:700;">${labels[g]}</td>
      <td style="text-align:right;padding:0.3rem 0.6rem;">${gen.length}</td>
      <td style="text-align:right;padding:0.3rem 0.6rem;">${f7fmt(medInc)}</td>
      <td style="text-align:right;padding:0.3rem 0.6rem;">${f7fmt(medW)}</td>
      <td style="text-align:right;padding:0.3rem 0.6rem;">${avgIQpts}</td></tr>`;
  });
  tbody.innerHTML=html;
}

/* ================================================================
   INTERACTION - TRAIT CANVAS
   ================================================================ */
let f7tDrag=false;
function f7traitMove(e) {
  const rect=f7TC.getBoundingClientRect();
  const px=(e.clientX-rect.left)*FT.W/rect.width, py=(e.clientY-rect.top)*FT.H/rect.height;
  f7.founders[f7.active].iqZ   =Math.max(-3.2,Math.min(3.2,f7tInvX(px)));
  f7.founders[f7.active].conscZ=Math.max(-3.2,Math.min(3.2,f7tInvY(py)));
  f7drawTrait();
}
f7TC.addEventListener('mousedown', e=>{f7tDrag=true;f7traitMove(e);});
f7TC.addEventListener('mousemove', e=>{if(f7tDrag)f7traitMove(e);});
f7TC.addEventListener('mouseup', ()=>f7tDrag=false);
f7TC.addEventListener('mouseleave',()=>f7tDrag=false);
f7TC.addEventListener('touchstart',e=>{e.preventDefault();f7tDrag=true;f7traitMove(e.touches[0]);},{passive:false});
f7TC.addEventListener('touchmove', e=>{e.preventDefault();if(f7tDrag)f7traitMove(e.touches[0]);},{passive:false});
f7TC.addEventListener('touchend', ()=>f7tDrag=false);

/* ================================================================
   INTERACTION - WEALTH CANVAS
   ================================================================ */
let f7wDrag=false;
function f7wealthMove(e) {
  const rect=f7WC.getBoundingClientRect();
  const px=(e.clientX-rect.left)*FW.W/rect.width;
  f7.founders[f7.active].wealthLog=Math.max(FW_LMIN+0.1,Math.min(FW_LMAX-0.1,f7wInvX(px)));
  f7drawWealth();
}
f7WC.addEventListener('mousedown', e=>{f7wDrag=true;f7wealthMove(e);});
f7WC.addEventListener('mousemove', e=>{if(f7wDrag)f7wealthMove(e);});
f7WC.addEventListener('mouseup', ()=>f7wDrag=false);
f7WC.addEventListener('mouseleave',()=>f7wDrag=false);
f7WC.addEventListener('touchstart',e=>{e.preventDefault();f7wDrag=true;f7wealthMove(e.touches[0]);},{passive:false});
f7WC.addEventListener('touchmove', e=>{e.preventDefault();if(f7wDrag)f7wealthMove(e.touches[0]);},{passive:false});
f7WC.addEventListener('touchend', ()=>f7wDrag=false);

/* ================================================================
   CONTROLS
   ================================================================ */
function f7setActive(key) {
  f7.active=key;
  const a=document.getElementById('f7-person-a'), b=document.getElementById('f7-person-b');
  a.style.background=key==='A'?'#8b3a1e':'white'; a.style.color=key==='A'?'white':'#8b3a1e';
  b.style.background=key==='B'?'#1a5c8a':'white'; b.style.color=key==='B'?'white':'#1a5c8a';
  f7drawTrait(); f7drawWealth();
}
document.getElementById('f7-person-a').addEventListener('click',()=>f7setActive('A'));
document.getElementById('f7-person-b').addEventListener('click',()=>f7setActive('B'));
document.getElementById('f7-sim-btn').addEventListener('click',()=>{
  f7simulate(); f7.displayedGens=0; f7.animating=true; setTimeout(f7animateReveal,300); });
document.getElementById('f7-reset-btn').addEventListener('click',()=>{
  f7.generations=[]; f7.simDone=false; f7.displayedGens=0; f7.animating=false;
  f7drawTrait(); f7drawWealth(); f7drawJoy(); f7drawWealthJoy(); f7updateStats(); });
document.getElementById('f7-kids').addEventListener('input',e=>{
  f7.kids=e.target.value/10; document.getElementById('f7-kids-val').textContent=f7.kids.toFixed(1); });
document.getElementById('f7-am').addEventListener('input',e=>{
  f7.am=e.target.value/100; document.getElementById('f7-am-val').textContent=f7.am.toFixed(2); });
document.getElementById('f7-biq').addEventListener('input',e=>{
  F7_B_IQ=e.target.value/100; document.getElementById('f7-biq-val').textContent=F7_B_IQ.toFixed(2); });

/* ================================================================
   INIT
   ================================================================ */
f7buildTCache();
f7buildWDens();
f7drawTrait();
f7drawWealth();
f7drawJoy();
f7drawWealthJoy();
})();

/* ============================================================
   FIGURE 3 (TLDR) - WHERE ARE YOU?
   ============================================================ */
(function () {
  var iqSlider    = document.getElementById('f9-iq');
  if (!iqSlider) return;
  var wSlider     = document.getElementById('f9-wealth');
  var readySlider = document.getElementById('f9-ready');
  var iqLabel     = document.getElementById('f9-iq-label');
  var wLabel      = document.getElementById('f9-wealth-label');
  var readyLabel  = document.getElementById('f9-ready-label');
  var incNowEl    = document.getElementById('f9-income-now');
  var incAiEl     = document.getElementById('f9-income-ai');
  var incAiNote   = document.getElementById('f9-income-ai-note');
  var oppEl       = document.getElementById('f9-opportunity');
  var cActW       = document.getElementById('f9-child-act-wealth');
  var cActT       = document.getElementById('f9-child-act-tier');
  var cActI       = document.getElementById('f9-child-act-income');
  var cNoW        = document.getElementById('f9-child-no-wealth');
  var cNoT        = document.getElementById('f9-child-no-tier');
  var cNoI        = document.getElementById('f9-child-no-income');

  var BASE = 75000;
  var B_IQ_NOW = 0.35, B_W_NOW = 0.45;
  var B_IQ_AI  = 0.10, B_W_AI  = 0.65;
  var THRESHOLD = 20000;
  var WINDOW_YEARS = 6;
  var ACT_READINESS = 80;

  var WEALTH_PTS = [
    [1, 200], [10, 800], [20, 4000], [30, 9000], [40, 17000],
    [50, 30000], [60, 52000], [70, 88000], [80, 148000],
    [90, 310000], [99, 1800000]
  ];

  function probit(p) {
    var a = [-3.969683028665376e+01, 2.209460984245205e+02,
             -2.759285104469687e+02, 1.383577518672690e+02,
             -3.066479806614716e+01, 2.506628277459239e+00];
    var b = [-5.447609879822406e+01, 1.615858368580409e+02,
             -1.556989798598866e+02, 6.680131188771972e+01,
             -1.328068155288572e+01];
    var c = [-7.784894002430293e-03, -3.223964580411365e-01,
             -2.400758277161838e+00, -2.549732539343734e+00,
              4.374664141464968e+00,  2.938163982698783e+00];
    var d = [7.784695709041462e-03, 3.224671290700398e-01,
             2.445134137142996e+00, 3.754408661907416e+00];
    var p_lo = 0.02425, p_hi = 1 - p_lo, q, r;
    if (p < p_lo) {
      q = Math.sqrt(-2 * Math.log(p));
      return (((((c[0]*q+c[1])*q+c[2])*q+c[3])*q+c[4])*q+c[5]) /
             ((((d[0]*q+d[1])*q+d[2])*q+d[3])*q+1);
    } else if (p <= p_hi) {
      q = p - 0.5; r = q*q;
      return (((((a[0]*r+a[1])*r+a[2])*r+a[3])*r+a[4])*r+a[5])*q /
             (((((b[0]*r+b[1])*r+b[2])*r+b[3])*r+b[4])*r+1);
    } else {
      q = Math.sqrt(-2 * Math.log(1-p));
      return -(((((c[0]*q+c[1])*q+c[2])*q+c[3])*q+c[4])*q+c[5]) /
               ((((d[0]*q+d[1])*q+d[2])*q+d[3])*q+1);
    }
  }

  function wealthDollars(pct) {
    for (var i = 0; i < WEALTH_PTS.length - 1; i++) {
      if (pct <= WEALTH_PTS[i+1][0]) {
        var t = (pct - WEALTH_PTS[i][0]) / (WEALTH_PTS[i+1][0] - WEALTH_PTS[i][0]);
        return WEALTH_PTS[i][1] + t * (WEALTH_PTS[i+1][1] - WEALTH_PTS[i][1]);
      }
    }
    return WEALTH_PTS[WEALTH_PTS.length-1][1];
  }

  function dollarsToZ(dollars) {
    var pct = WEALTH_PTS[0][0];
    for (var i = 0; i < WEALTH_PTS.length - 1; i++) {
      if (dollars <= WEALTH_PTS[i+1][1]) {
        var t = (dollars - WEALTH_PTS[i][1]) / (WEALTH_PTS[i+1][1] - WEALTH_PTS[i][1]);
        pct = WEALTH_PTS[i][0] + t * (WEALTH_PTS[i+1][0] - WEALTH_PTS[i][0]);
        break;
      }
      pct = WEALTH_PTS[i+1][0];
    }
    pct = Math.max(1, Math.min(99, pct));
    return probit(pct / 100);
  }

  function fmt(n) {
    return '$' + Math.round(n).toLocaleString();
  }

  function fmtK(n) {
    if (Math.abs(n) >= 1000) return '$' + Math.round(n / 1000) + 'k';
    return '$' + Math.round(n);
  }

  function tierHTML(dollars) {
    if (dollars >= THRESHOLD) {
      return '<span style="color:#2e7d32; font-weight:700;">&#10003; above $20k \u2014 compounding active</span>';
    } else {
      return '<span style="color:#8b3a1e; font-weight:700;">&#10007; below $20k \u2014 compounding inactive</span>';
    }
  }

  function update() {
    var iqPct     = parseInt(iqSlider.value);
    var wPct      = parseInt(wSlider.value);
    var readiness = parseInt(readySlider.value);

    iqLabel.textContent    = iqPct + 'th pct';
    wLabel.textContent     = wPct + 'th pct';
    readyLabel.textContent = readiness + ' / 100';

    var zIQ = probit(iqPct / 100);
    var zW  = probit(wPct  / 100);

    var incNow = BASE * Math.exp(B_IQ_NOW * zIQ + B_W_NOW * zW);
    var incAI  = BASE * Math.exp(B_IQ_AI  * zIQ + B_W_AI  * zW);

    incNowEl.textContent = fmt(incNow) + ' / yr';
    incAiEl.textContent  = fmt(incAI)  + ' / yr';

    if (incAI < incNow) {
      incAiEl.style.color   = '#8b3a1e';
      incAiNote.textContent = 'per year \u2014 lower than today';
    } else {
      incAiEl.style.color   = '#1a5c8a';
      incAiNote.textContent = 'per year \u2014 wealth position gains';
    }

    var modifier      = 1 + 0.25 * Math.max(0, zIQ);
    var annualCurrent = (readiness / 100) * 65000 * modifier;
    var annualActing  = (ACT_READINESS / 100) * 65000 * modifier;
    var lifetimeDelta = Math.max(0, annualActing - annualCurrent) * WINDOW_YEARS;
    var wealthDelta   = lifetimeDelta * 0.20;

    if (readiness >= ACT_READINESS) {
      oppEl.innerHTML = '<span style="color:#6f777d; font-size:0.9rem;">Window largely captured \u2014 readiness already at acting threshold</span>';
    } else {
      oppEl.innerHTML = fmtK(lifetimeDelta) + ' lifetime<br>' +
        '<span style="font-size:0.9rem; color:#6f777d;">' + fmtK(wealthDelta) + ' estimated wealth</span>';
    }

    var parentDollars = wealthDollars(wPct);
    var childNoAct    = parentDollars * 0.5;
    var childAct      = parentDollars * 0.5 + wealthDelta * 0.5;

    var zChildIQ   = 0.5 * zIQ;
    var zChildWNo  = dollarsToZ(childNoAct);
    var zChildWAct = dollarsToZ(childAct);

    var incChildNo  = BASE * Math.exp(B_IQ_AI * zChildIQ + B_W_AI * zChildWNo);
    var incChildAct = BASE * Math.exp(B_IQ_AI * zChildIQ + B_W_AI * zChildWAct);

    cActW.textContent = fmt(childAct);
    cActT.innerHTML   = tierHTML(childAct);
    cActI.textContent = fmt(incChildAct) + ' / yr';
    cActI.style.color = '#1a5c8a';

    cNoW.textContent = fmt(childNoAct);
    cNoT.innerHTML   = tierHTML(childNoAct);
    cNoI.textContent = fmt(incChildNo) + ' / yr';
    cNoI.style.color = '#8b3a1e';
  }

  iqSlider.addEventListener('input', update);
  wSlider.addEventListener('input', update);
  readySlider.addEventListener('input', update);
  update();
})();

</script>]]></content><author><name>Approaching 50%</name></author><category term="M &amp; E" /><category term="AI" /><category term="probability" /><category term="genetics" /><category term="inequality" /><category term="AI" /><category term="gaussian" /><category term="wealth" /><category term="inheritance" /><summary type="html"><![CDATA[AI is dismantling the mechanism that let intelligence convert into heritable wealth. Robotics is building to remove what's left. Two waves, two to three decades, and capital ownership becomes the only income that doesn't erode - with interactive simulations to show you the arithmetic.]]></summary></entry><entry><title type="html">Your bridge to wealth is being pulled up</title><link href="https://danielhomola.com/m%20&%20e/ai/your-bridge-to-wealth-is-being-pulled-up/" rel="alternate" type="text/html" title="Your bridge to wealth is being pulled up" /><published>2026-03-21T00:00:00+01:00</published><updated>2026-03-21T00:00:00+01:00</updated><id>https://danielhomola.com/m%20&amp;%20e/ai/your-bridge-to-wealth-is-being-pulled-up</id><content type="html" xml:base="https://danielhomola.com/m%20&amp;%20e/ai/your-bridge-to-wealth-is-being-pulled-up/"><![CDATA[<style>
/* ── scoped overrides inside MM's .page__content ─────────── */

.page__content p {
  font-size: 1.05rem;
  line-height: 1.82;
  margin-bottom: 1.4em;
}

/* Drop cap */
.page__content .dropcap::first-letter {
  float: left;
  font-size: 4em;
  line-height: 0.75;
  font-weight: 700;
  padding-right: 0.07em;
  padding-top: 0.04em;
  color: #1a1d1e;
}

/* Section markers */
.page__content .section-marker {
  font-size: 1.5em;
  font-weight: bold;
  text-transform: uppercase;
  letter-spacing: 0.18em;
  text-align: center;
  padding-bottom: 2em;
  color: #6f777d;
  margin: 2.8rem 0 0;
  display: block;
}

/* Override MM blockquote */
.page__content blockquote {
  border-left: 4px solid #dee1e4;
  padding: 0 1.4em;
  margin: 1.8em 0;
  font-style: italic;
  font-size: 1.1rem;
  color: #6f777d;
  line-height: 1.7;
  background: none;
}
.page__content blockquote p {
  margin: 0;
  font-size: inherit;
  color: inherit;
}

/* Notice-style aside */
.page__content .aside {
  background: #f8f9fa;
  border: 1px solid #dee1e4;
  border-left: 4px solid #c5cdd4;
  border-radius: 3px;
  padding: 0.9rem 1.1rem;
  margin: 1.8em 0;
  font-size: 0.9rem;
  color: #6f777d;
  line-height: 1.65;
}
.page__content .aside strong {
  display: block;
  font-size: 0.7rem;
  text-transform: uppercase;
  letter-spacing: 0.1em;
  color: #3d4144;
  margin-bottom: 0.3em;
  font-style: normal;
}

/* Ornamental separator */
.page__content .ornament {
  text-align: center;
  color: #dee1e4;
  font-size: 1rem;
  letter-spacing: 0.5em;
  margin: 2.5rem 0;
}

/* Coda */
.page__content .coda {
  margin-top: 3rem;
  padding-top: 2rem;
  border-top: 1px solid #f2f3f3;
}
.page__content .coda-text {
  font-style: italic;
  font-size: 1.05rem;
  color: #6f777d;
  line-height: 1.7;
  margin: 0;
}
.page__content .end-ornament {
  text-align: center;
  margin-top: 1.5rem;
  color: #dee1e4;
  font-size: 1.2rem;
}

/* ── visualisation widgets (not scoped - specific enough) ─── */
:root {
  --viz-accent: #7a3218;
  --viz-border: #dee1e4;
  --viz-bg:     #fafafa;
}

.viz-widget {
  background: var(--viz-bg);
  border: 1px solid var(--viz-border);
  border-radius: 4px;
  padding: 1.2rem 1.2rem 0.9rem;
  margin: 2rem 0;
  overflow: hidden;
}
.viz-header { margin-bottom: 0.7rem; }
.viz-tag {
  font-size: 0.68rem;
  font-weight: 700;
  text-transform: uppercase;
  letter-spacing: 0.18em;
  color: var(--viz-accent);
  display: block;
  margin-bottom: 0.15rem;
}
.viz-title-text {
  font-size: 0.95rem;
  font-weight: 700;
  color: #1a1d1e;
}
.viz-svg { width: 100%; display: block; overflow: visible; }
.viz-controls {
  display: flex;
  flex-wrap: wrap;
  gap: 0.6rem 1.4rem;
  align-items: center;
  margin-top: 0.7rem;
  font-size: 0.82rem;
  color: #6f777d;
}
.viz-control-group { display: flex; align-items: center; gap: 0.45rem; }
.viz-control-group label { white-space: nowrap; }
.viz-control-group > span {
  font-style: italic;
  color: var(--viz-accent);
  min-width: 36px;
  font-weight: 700;
}
input[type="range"] {
  -webkit-appearance: none;
  height: 3px;
  background: #dee1e4;
  border-radius: 3px;
  width: 110px;
  cursor: pointer;
}
input[type="range"]::-webkit-slider-thumb {
  -webkit-appearance: none;
  width: 14px; height: 14px;
  background: var(--viz-accent);
  border-radius: 50%;
  cursor: pointer;
  border: 2px solid #fff;
  box-shadow: 0 0 0 1px var(--viz-accent);
}
.viz-caption {
  font-size: 0.8rem;
  color: #6f777d;
  line-height: 1.55;
  font-style: italic;
  margin-top: 0.7rem;
  padding-top: 0.65rem;
  border-top: 1px solid var(--viz-border);
}
.viz-row { display: flex; gap: 0; align-items: stretch; }
.viz-canvas-wrap { position: relative; flex-shrink: 0; }
.viz-canvas-wrap canvas { display: block; }
.viz-canvas-wrap svg { position: absolute; top: 0; left: 0; pointer-events: none; }
#v4-canvas { cursor: col-resize; }

.viz-tooltip {
  position: fixed;
  background: #1a1d1e;
  color: #fff;
  font-size: 0.78rem;
  padding: 0.4rem 0.7rem;
  border-radius: 3px;
  pointer-events: none;
  opacity: 0;
  transition: opacity 0.12s;
  z-index: 9999;
  max-width: 240px;
  line-height: 1.5;
}

@media (max-width: 600px) {
  .viz-row { flex-direction: column; }
  .page__content p { font-size: 1rem; }
}
</style>

<!-- ═══════════════════════════════════════════════════════════
     ESSAY BODY
     ═══════════════════════════════════════════════════════════ -->

<div class="notice--primary">
  This post is part of my <a href="/m%20&%20e/letters-to-m-and-e/"><strong>Letters to M &amp; E</strong></a> series.
</div>


<span class="section-marker">Preface</span>
<div class="aside" style="margin-bottom:2.5rem; border-left:3px solid #1a1d1e; background:#f7f6f4;">

  <p style="margin:0.8rem 0 0; color:#3d4144; font-size: 0.97rem">I want to make three claims: two about the world we live in and one about the future ahead of us.</p>
  <p style="margin:0.8rem 0 0; color:#3d4144; font-size: 0.97rem"><strong>The first is mathematical</strong> Most of the traits you were born with - intelligence, conscientiousness, height, bone density, grip strength, resting heart rate - follow a bell curve. They are Gaussian: symmetric, mean-reverting, self-averaging. The wealth you were born into is not. Wealth follows a power law. The top 1% of American households holds more than the bottom 50% combined. The mean is five times the median. These are not the same kind of object. When you multiply a bell curve by a power law to produce a life outcome, the power law dominates. Per standard deviation, parental wealth predicts a child's adult income at least as strongly as the child's own cognitive ability - and the gap widens substantially at the extremes, where the power-law tail of wealth extends far beyond anything the Gaussian bell curve of IQ can reach. One regresses. The other compounds. </p>
  <p style="margin:0.8rem 0 0; color:#3d4144; font-size: 0.97rem"><strong>The second is structural</strong> The historical wire from IQ through credentials to high-paying work is being cut by artificial intelligence - and understanding why that matters requires a brief detour into how it was built.</p>
  <p style="margin:0.8rem 0 0; color:#3d4144; font-size: 0.97rem">For most of human history, two inheritance systems ran in parallel and didn't communicate. Biological traits passed through chromosomes: stochastic, noisy, tending back toward the average across generations. Wealth passed through property law: wills, trusts, title deeds, institutional relationships. No regression. No noise. Just compounding. Then the French Revolution, industrial capitalism, and the credential systems of the nineteenth and twentieth centuries built a bridge between them: IQ → credentials → income → heritable wealth. For the first time at scale, cognitive ability could escape the class it was born into.</p>
  <p style="margin:0.8rem 0 0; color:#3d4144; font-size: 0.97rem">Artificial intelligence is dismantling that bridge. Large language models already match median professional performance on the routine tasks that constitute a large fraction of professional billing across legal research, financial analysis, software engineering, and diagnostic reasoning. The IQ premium in the labour market is collapsing. The capital premium is not. The coefficient on inherited wealth in the income equation is rising as the coefficient on cognitive ability falls - and the transition is measured in years, not decades.</p>
  <p style="margin:0.8rem 0 0; color:#3d4144; font-size: 0.97rem"><strong>The third is a prediction</strong>When the bridge closes, what remains is what was always there underneath it: two systems running on different mathematics, no longer connected. The wealthy class keeps the compounding clock. Everyone else keeps the biological one - the one that tends, however slowly, back toward the centre. For about ten generations the bridge existed and the two could communicate. A brilliant person from a modest background could cross. When it closes, the crossing stops. Each side compounds its own logic across generations. That asymmetry, left to run, has a historical name: aristocracy - not by decree, but by ruthless compounding.</p>
  <p style="margin:0.8rem 0 0; color:#3d4144; font-size: 0.97rem">But the transition is not complete. Deep domain knowledge combined with AI fluency is scarce in a way that inherited wealth cannot buy - it is gated by speed and expertise, things a person with ability and modest starting wealth can actually have. That window is the next five to ten years. After it closes, the legal inheritance system runs alone. UBI and aggressive capital taxation can floor the bottom and slow the compounding at the top - but they cannot create new entrants at the top in a world where labour no longer generates enough surplus to accumulate capital from scratch.</p>
  <p style="margin:0.8rem 0 0; color:#3d4144; font-size: 0.97rem">Watch the labour share of GDP against capital returns. Watch whether professional income and inherited wealth grow more correlated in the same households over the next decade. These numbers are published quarterly. The current trajectory already points in one direction.</p>
  <p style="margin:0.8rem 0 0; color:#3d4144; font-size: 0.97rem">This essay builds all three claims carefully - with interactive simulations, a calibrated model, and a political argument about which levers are actually available. It takes about an hour to read. What it offers is a precise map of a transition window: where it came from, how long it stays open, and what the world looks like after it closes. Most of it is interactive - you will spend more time running simulations than reading sentences. I built this framework to understand my children's futures. I think it will change how you see yours.</p>
  
</div>

<span class="section-marker">I - The perfect curve</span>
<p class="dropcap">There is a person you know for whom things seem to accumulate. The talent that opens the first door. The confidence that follows from early success. The looks that made teachers kinder and strangers more generous. The money that arrived, eventually, as though drawn by some quiet gravity. You watch from nearby and feel something complicated: not quite envy, but a dawning suspicion that the universe is not neutral. That some lives are tilted toward abundance and others toward an endless subtle friction. You wonder if this is luck, or structure, or something so deep it has no name.</p>
<p>Begin with the simplest version of the question. Why does this person seem to have everything? The mathematics has an answer - and it starts with a bell curve.</p>


<h2>Why the person who seems to have everything probably does</h2>

<p>Take height first. It arises from hundreds of genes, each contributing a tiny nudge upward or downward from some baseline. No single gene determines whether you are tall; it is the accumulation of small effects that matters. And because of a theorem so central to probability theory that it is called the Central Limit Theorem, the sum of many small, independent influences converges to a single, symmetrical, bell-shaped distribution. Not approximately. Exactly, in the limit. The Gaussian curve is not merely a description of height. It is a mathematical inevitability wherever many small additive forces conspire to produce a single outcome.</p>

<p>This is the infinitesimal model, first formalized by R.A. Fisher in 1918, and it is why human height, IQ scores, bone density, grip strength, and dozens of other traits distribute themselves in elegant bells across any large population. Now extend the picture. A person is not a single number but a <em>profile</em> of measurements - intelligence, physical vitality, emotional resilience, social ease, drive. The right mathematical object for all of this at once is the <strong>multivariate Gaussian</strong>: a joint distribution over many variables, each marginally bell-shaped, related through a covariance matrix Σ.</p>

<p>Here is a beautiful mathematical fact: the marginals of a multivariate Gaussian are themselves Gaussian. Pull out any single trait, look at it alone, and the bell curve re-emerges. But the covariance matrix - the grid of numbers relating every trait to every other - is where all the interesting structure lives.</p>

<div class="viz-widget">
  <div class="viz-header">
    <span class="viz-tag">Figure 1 - Interactive</span>
    <span class="viz-title-text">The Shape of a Joint Distribution</span>
  </div>
  <svg id="v1-svg" class="viz-svg" viewBox="0 0 500 420"></svg>
  <div class="viz-controls">
    <div class="viz-control-group">
      <label>Correlation ρ =</label>
      <span id="v1-rho-display">0.00</span>
      <input type="range" id="v1-rho" min="-95" max="95" value="0" step="1">
    </div>
  </div>
  <div class="viz-caption">Contour ellipses enclose ~39%, ~87%, and ~99% of the probability mass. Drag the slider to change ρ. The marginal distributions on the sides - always <em>N</em>(0,1) - never change no matter what ρ is. Correlation lives only in the joint distribution.</div>
</div>


<p>One caveat worth naming: this framework works for traits, not for wealth or social status - those are different mathematical objects entirely. Social status is a <em>ranking</em> - it is by definition zero-sum, ordinal, and structurally incapable of a normal distribution, because every point gained by one person requires a point lost by another. Wealth follows something closer to a power law: the mean is five times the median, the top 1% holds more than the bottom 50% combined, and the "average" wealth is a statistical ghost that nobody actually has. What happens when Gaussian biology meets power-law economics is the more interesting question, which the essay turns to in Section III.</p>

<h2>One in 3.6 million, if traits were free</h2>

<p>Imagine that the covariance matrix were diagonal - zeros everywhere off the main axis. This is the world of independence: knowing how tall you are tells you nothing about how quick your mind is, which tells you nothing about the symmetry of your face, which tells you nothing about how hard you work. In this world, probability is ruthless and clean. If being two standard deviations above average in any given trait occurs with roughly 2.3% frequency, then being exceptional in two independent traits simultaneously occurs with probability 0.023 × 0.023 - about one person in 1,900. Three dimensions: one in 83,000. Four: one in 3.6 million. The math does not merely say such people are rare. It says they are <em>essentially impossible</em>. Yet they exist. We've all encountered one.</p>


<p>If independence predicts near-impossibility and the actual world contains observable frequency, then the off-diagonal elements of Σ are not zero. Human traits <em>covary</em>. The visualization below makes this collapse visceral.</p>

<div class="viz-widget">
  <div class="viz-header">
    <span class="viz-tag">Figure 2 - Interactive</span>
    <span class="viz-title-text">The Collapse of Probability Across Dimensions</span>
  </div>
  <svg id="v2-svg" class="viz-svg" viewBox="0 0 560 300"></svg>
  <div class="viz-controls">
    <div class="viz-control-group">
      <label>Threshold z =</label>
      <span id="v2-z-display">2.0</span><span style="font-size:0.75rem;margin-left:-3px">σ</span>
      <input type="range" id="v2-z" min="10" max="30" value="20" step="1">
    </div>
    <div class="viz-control-group">
      <label>Correlation ρ =</label>
      <span id="v2-rho-display">0.30</span>
      <input type="range" id="v2-rho" min="0" max="80" value="30" step="1">
    </div>
  </div>
  <div class="viz-caption">Grey line: probability under full independence (ρ = 0). Red line: probability under equicorrelation at ρ. Even modest correlation dramatically slows the collapse - which is precisely why multi-dimensional exceptional people exist at observable frequency. Computed using compound-symmetry Gaussian integration.</div>
</div>

<span class="section-marker">II - Why advantages cluster</span>

<h2>Four explanations: three biological, one legal</h2>

<p>The correlation between desirable human traits is not one thing. It is the composite residue of at least four distinct processes, each operating at a different timescale and by a different mechanism. The first three are biological and social. The fourth is legal - and it operates on entirely different mathematics.</p>

<p>The first is <strong>assortative mating</strong> - the ancient and powerful tendency of humans to pair with those who resemble them. The mate-selection market, for all its apparent chaos, is organized around overall desirability: people near the top of the distribution tend to pair with people near the top, drawing from whatever dimensions are locally valued. An intelligent man of high status pairs with a beautiful and capable woman. Their children inherit genes for intelligence and for attractiveness simultaneously, not because any single gene codes for both, but because the alleles for each traveled together through the pairing. Repeat this across ten generations, and what were initially independent trait distributions begin to develop correlations - not because nature linked them biologically, but because humans linked them socially, over and over, until the links became hereditary.</p>

<div class="aside">
  <strong>Technical note</strong>
  This process - cross-trait assortative mating creating what geneticists call "gametic phase disequilibrium" - has been formalized only recently with genome-wide association data. A 2022 paper in <em>Science</em> found that cross-trait assortative mating alone could account for a substantial fraction of the genetic correlations between disparate traits previously attributed to pleiotropy.<sup><a href="https://www.science.org/doi/10.1126/science.abo2059" target="_blank" rel="noopener">7</a></sup> The correlation structure of human traits is, in part, a social artifact.
</div>

<p>The second mechanism is <strong>pleiotropy</strong> - the biological reality that many genes do not specialize in a single function. A body developing under favorable genetic conditions tends to develop well across multiple systems simultaneously. Health is not one thing. It is a general regime of developmental integrity, and when that regime is present, it elevates many traits at once.</p>

<p>The third mechanism is the most philosophically uncomfortable: <strong>social compounding</strong>. The world treats attractive people as though they are intelligent. It invests more in children who seem promising. Those investments return dividends that are indistinguishable, in outcome, from raw biological ability. The correlation was not in the genes. It was manufactured by a world that could not stop projecting one quality onto the others.</p>

<p>The fourth mechanism sits outside the Gaussian framework entirely: <strong>legal inheritance</strong>. Biological traits transmit through meiosis - stochastic, noisy, self-correcting. Each generation, extreme values dilute. Wealth transmits through property law - wills, trusts, the step-up in basis at death, alumni networks and board seats. It does not regress. It does not shuffle. It passes whole and compounds. Two people with identical trait profiles but different starting wealth are not at the same point in any joint distribution of outcomes. They are operating under different physics. This is the hinge on which the rest of the essay turns.</p>

<h2>How correlated are our traits?</h2>

<p>Cross-trait correlations are real but modest: the well-established pairs (height–IQ, wealth–IQ, IQ–income) survive rigorous methodology at r = 0.15–0.40, while others - attractiveness–IQ in particular - reduce to near zero under independent measurement and proper controls. The correlation that matters most for the argument that follows is wealth–IQ (r &#8776; 0.35–0.40): wealth buys the environments that build cognitive ability, and high-IQ parents pass both genes and capital to the same children - a first sign that the biological and legal inheritance channels are currently coupled.</p>

<div style="margin:1.5rem 0; background:#f7f6f4; border-left:3px solid #3d5a47;">
  <div onclick="var c=this.nextElementSibling,a=this.querySelector('.mod-arrow');c.style.display=c.style.display==='block'?'none':'block';a.textContent=c.style.display==='block'?'&#9660; collapse':'&#9654; expand';" style="padding:0.8rem 1.5rem; cursor:pointer; display:flex; align-items:center; justify-content:space-between; user-select:none;">
    <div style="font-size:0.65rem; font-weight:700; text-transform:uppercase; letter-spacing:0.12em; color:#3d5a47;">What the studies show</div>
    <span class="mod-arrow" style="font-size:0.68rem; color:#3d5a47; font-weight:700; letter-spacing:0.06em;">&#9654; expand</span>
  </div>
  <div style="display:none; padding:0 1.5rem 1.2rem;">
    <p>In cognition, the evidence is most robust. The <em>positive manifold</em> - the finding that all measured cognitive abilities correlate positively with one another - has been described as arguably the most replicated result in all of psychology.<sup><a href="https://en.wikipedia.org/wiki/G_factor_(psychometrics)" target="_blank" rel="noopener">1</a></sup> No matter how different two cognitive tests are, scores on them tend to move together. This structural property emerges from factor analyses of thousands of test batteries across dozens of countries and cultures, making it uniquely immune to the usual confounder concerns: it is a mathematical property of the score matrix, not a relationship between measured outcomes. From it emerges <em>g</em>, the general factor of intelligence, which typically accounts for forty to fifty percent of the total variance in any diverse cognitive battery.<sup><a href="https://en.wikipedia.org/wiki/Human_Cognitive_Abilities" target="_blank" rel="noopener">2</a></sup></p>

    <p>Between domains, the picture becomes more complicated - and more honest methodology matters enormously. The height–IQ correlation (r ≈ 0.15–0.20) has been examined in a large nuclear twin-family design that explicitly models and controls for assortative mating, partitioning the covariance into its genetic and environmental components and separating genuine pleiotropy from the statistical artifact of correlated alleles built up through generations of mate choice.<sup><a href="https://journals.plos.org/plosgenetics/article?id=10.1371/journal.pgen.1003451" target="_blank" rel="noopener">3</a></sup> Even after this rigorous decomposition, roughly half the correlation survives as shared additive genetic variance - modest, but real. Intelligence predicts income with replicated correlations around 0.35–0.40, a relationship that holds across multiple datasets and partly survives controls for education, age, and socioeconomic background.<sup><a href="https://en.wikipedia.org/wiki/Cognitive_epidemiology" target="_blank" rel="noopener">4</a></sup></p>

    <p>The attractiveness–IQ pairing requires particular care, because it is where the literature has been most misleading. Early studies, including the frequently-cited work of Kanazawa (2011) using large British and American cohorts, did control for social class, body size, and health - and found correlations of r = 0.13–0.38.<sup><a href="https://personal.lse.ac.uk/kanazawa/pdfs/i2011.pdf" target="_blank" rel="noopener">5</a></sup> However, a critical flaw undermines the stronger of those estimates: in the British cohort, the same teacher who assessed a child's intelligence also rated their physical attractiveness, making the two measures non-independent and inflating the correlation through evaluator bias. The most methodologically rigorous study to date - Mitchem et al. (2015), using a large twin and sibling sample with <em>independently collected</em> measures of facial attractiveness and IQ, and a design capable of partitioning genetic from environmental covariance - found <strong>no phenotypic or genetic correlation</strong> between the traits.<sup><a href="https://pmc.ncbi.nlm.nih.gov/articles/PMC4415372/" target="_blank" rel="noopener">6</a></sup> Their meta-analysis further found that reported effect sizes decrease as sample size increases (r = &#8722;0.41 between log N and effect size), a signature of publication bias: small studies showing a correlation got published; equally small studies showing nothing did not. The honest current estimate for the attractiveness–IQ correlation is probably near zero or at most weakly positive - and most of what earlier studies captured was likely methodological artifact.</p>

    <p>The overall picture is a covariance matrix that is not diagonal - but also less strongly off-diagonal than a casual reading of the literature suggests, and almost certainly less so for attractiveness than the heatmap below implies. The correlations that survive rigorous confounder control and large-sample pre-registration tend to be modest: r = 0.15–0.40 for the better-established pairs, near zero for others. The space of human possibility is genuinely high-dimensional, with desirable traits positively but loosely correlated - when good methodology is applied.</p>

    <p style="margin-bottom:0;">The correlation that matters most for the argument that follows is the one between wealth and everything else. Wealth&#8211;IQ (r &#8776; 0.35&#8211;0.40) is large partly because wealth buys the environments that develop cognitive ability - nutrition, schooling, stability, the absence of chronic stress - and partly because high-IQ parents earn more and pass both the genes and the capital to the same children. This bidirectional causation is the first hint that the biological and legal channels are not independent. They are already coupled. The question Section III asks is what happens when they couple further.</p>
  </div>
</div>

<div class="viz-widget">
  <div class="viz-header">
    <span class="viz-tag">Figure 3 - Empirical</span>
    <span class="viz-title-text">Estimated Trait Correlation Matrix</span>
  </div>
  <svg id="v3-svg" class="viz-svg" viewBox="0 0 500 510"></svg>
  <div class="viz-caption">Approximate pairwise correlations synthesised from population-based empirical literature. Hover over cells for source notes. <strong>Important caveat:</strong> the attractiveness–IQ cell (r ≈ 0.10) should be treated with scepticism - the best-controlled study (Mitchem et al., 2015<sup><a href="https://pmc.ncbi.nlm.nih.gov/articles/PMC4415372/" target="_blank" rel="noopener">6</a></sup>) found no significant correlation, and a meta-analysis found clear publication bias in the prior literature. All other correlations shown here are from larger, better-controlled studies. Wealth–IQ is substantial (r ≈ 0.35–0.40) and survives controls for education and SES. Height–IQ (r ≈ 0.18) has been decomposed in a twin-family design controlling for assortative mating.<sup><a href="https://journals.plos.org/plosgenetics/article?id=10.1371/journal.pgen.1003451" target="_blank" rel="noopener">3</a></sup></div>
</div>

<p>The conditional distribution - what observing someone to be exceptional in one dimension tells you about the others - is perhaps the most practically important consequence of this structure. If ρ = 0, learning that someone is brilliant tells you nothing about whether they are also beautiful or wealthy. If ρ = 0.3, it shifts your expectation modestly but far from deterministically.</p>

<div class="viz-widget">
  <div class="viz-header">
    <span class="viz-tag">Figure 4 - Interactive</span>
    <span class="viz-title-text">What Knowing One Trait Tells You About Another</span>
  </div>
  <div class="viz-row" id="v4-row" style="flex-direction:row; gap:1px; background:#dee1e4;">
    <div class="viz-canvas-wrap" id="v4-left" style="width:50%;">
      <canvas id="v4-canvas" width="420" height="420" style="width:100%; aspect-ratio:1/1; display:block;"></canvas>
      <svg id="v4-overlay" viewBox="0 0 420 420" style="width:100%; aspect-ratio:1/1;"></svg>
    </div>
    <div style="width:50%; background:#fff;">
      <svg id="v4-cond-svg" class="viz-svg" viewBox="0 0 280 280" style="display:block; width:100%; aspect-ratio:1/1;"></svg>
    </div>
  </div>
  <div class="viz-controls">
    <div class="viz-control-group">
      <label>Correlation ρ =</label>
      <span id="v4-rho-display">0.30</span>
      <input type="range" id="v4-rho" min="-90" max="90" value="30" step="1">
    </div>
    <div style="font-style:italic; font-size:0.8rem; color:var(--viz-accent);" id="v4-formula"></div>
  </div>
  <div class="viz-caption">Click or drag the vertical line on the heatmap to condition on a value of X₁. The right panel shows the resulting conditional distribution X₂ | X₁ = x₀, which is N(ρx₀, 1−ρ²). When ρ = 0, the conditional distribution never changes - knowing X₁ tells you nothing. When |ρ| is large, observation dramatically updates your expectation.</div>
</div>


<div class="ornament">· · ·</div>

<span class="section-marker">III - Where the Gaussian world ends</span>

<h2>There is no meiosis for money</h2>

<p>The framework built so far quietly assumes that all human traits live in the same mathematical space. They do not. IQ, height, and conscientiousness are approximately Gaussian - sums of many small additive effects, bell-curved, self-averaging. Wealth is not. It follows a power law, or something close to it, where the mean is a fiction and the tail contains a disproportionate share of everything.</p>

<p>The mean US household net worth in 2022 was approximately $1.06 million. The <em>median</em> was $193,000.<sup><a href="https://www.federalreserve.gov/publications/files/scf23.pdf" target="_blank" rel="noopener">9</a></sup> The gap between them - a factor of more than five - is the signature of a power-law distribution, where a small number of extreme values pull the mean far above the middle. For a Gaussian, mean and median are identical. The fact that they diverge so dramatically for wealth tells you immediately that wealth is not Gaussian. The &#8220;average person&#8221; in the wealth distribution is a statistical ghost. The figure below shows what the real distribution looks like on a linear scale: not a bell, but an asymmetric curve with almost all households packed toward the left and a near-invisible tail that nevertheless contains an enormous fraction of all wealth. One of the favourite tricks of statisticians is to log-transform this data - compressing those vast extremes into equal visual steps - and watch it snap into a shape that looks almost familiar. Try it yourself using the toggle below.</p>

<div class="viz-widget" id="f5-widget">
  <div class="viz-header">
    <span class="viz-tag">Figure 5 - Empirical</span>
    <span class="viz-title-text">US Household Net Worth Distribution (Federal Reserve SCF 2022)</span>
  </div>
  <svg id="v5-svg" class="viz-svg" viewBox="0 0 560 320"></svg>
  <div class="viz-controls">
    <div class="viz-control-group" style="justify-content:center; padding:0.2rem 0 0.1rem;">
      <button id="v5-toggle" style="padding:0.4rem 1.2rem; font-size:0.82rem; background:#1a1d1e; color:#fff; border:none; border-radius:3px; cursor:pointer; font-weight:600; letter-spacing:0.04em;">Try log scale &#8594;</button>
    </div>
    <div class="viz-control-group">
      <label>Your position:</label>
      <input type="range" id="v5-slider" min="0" max="99" value="50" step="1" style="width:180px;">
      <span id="v5-label" style="font-style:italic; color:var(--viz-accent); font-weight:700; min-width:180px;"></span>
    </div>
  </div>
  <div class="viz-caption" id="v5-caption">US household net worth (Federal Reserve SCF 2022). The <strong>linear view</strong> shows the true power-law shape - almost all households packed toward the left, with a vast tail extending rightward. The <strong>log scale</strong> (toggle above) places each 10&#215; step at equal visual width, transforming the distribution into a roughly bell-shaped curve. Note that &#8764;11% of households have zero or negative net worth. The top 1% appears as a compressed sliver on the log scale, yet holds more wealth than the entire bottom 90% combined.<sup><a href="https://en.wikipedia.org/wiki/Wealth_inequality_in_the_United_States" target="_blank" rel="noopener">10</a></sup></div>
</div>

<p>That distribution shape is the first rupture in the Gaussian framework. The second is deeper: the mechanism by which wealth transmits across generations is nothing like the genetic mechanism we have been discussing. Biological traits travel through meiosis and recombination - a stochastic shuffling that guarantees regression toward the population mean. The child of two people with IQs of 130 will, on average, have an IQ closer to 115. Extreme values are diluted. The biological inheritance system is, over the long run, self-correcting.</p>

<p>Wealth transmits through <em>property law</em>. A trust fund does not regress to the mean. A house valued at $2 million does not become a house valued at $1 million when it passes to the next generation - it appreciates. Capital earns returns. The legal mechanisms governing wealth transmission - inheritance law, gift tax thresholds, the step-up in basis at death, the dynasty trust - are specifically designed to preserve and concentrate, not to randomise and disperse. Jeff Bezos&#8217;s parents invested $250,000 in Amazon in 1995.<sup><a href="https://en.wikipedia.org/wiki/Jeff_Bezos" target="_blank" rel="noopener">11</a></sup> That was not a trait transmitted through DNA. It was capital transmitted through a bank wire, subject to none of the biological regression that governs cognitive inheritance. Harvard&#8217;s legacy admission rate runs roughly six to seven times the standard rate<sup><a href="https://en.wikipedia.org/wiki/Legacy_preferences_in_college_admissions" target="_blank" rel="noopener">12</a></sup> - an advantage transmitted not through chromosomes but through alumni directories and donation records. These are not edge cases. They are illustrations of a general principle: the legal inheritance channel compounds while the biological one reverts. The question is what happens when both operate on the same person simultaneously.</p>

<p>The answer depends on where that person stands in the wealth distribution - because below a certain level, the compounding mechanism of the legal clock simply does not operate. Below roughly the bottom quartile of US household net worth - approximately $10,000&#8211;$30,000 in liquid assets - income is fully absorbed by subsistence: rent, food, consumer debt servicing. There is nothing left to save. And without savings, the pathway through which IQ translates into intergenerational wealth - each standard deviation above the mean adding roughly four percentage points to the savings rate in the model - is worth nothing at all. Above this threshold, both clocks run simultaneously. Below it, only the biological clock runs - and it runs backward toward the mean. The floor is not merely a hard starting position. It is, in a precise mathematical sense, a different country with different rules.</p>

<p>The two inheritance systems are therefore not parallel tracks at different speeds. They interact. A high-IQ child born below the asset floor is not simply a high-IQ adult with constrained resources - they are someone whose trait advantages cannot activate the savings channel, whose cognitive returns have nowhere to compound, whose every step requires overcoming institutional friction calibrated for a different starting position. Conversely, a modest-ability child born into substantial wealth is not merely advantaged in a financial sense: capital acts as a multiplier on every trait they possess, converting even average ability into above-average outcomes through access, network, and the quiet legitimacy that an inherited position confers. The biological lottery and the legal lottery are not just unequal in size. They are running on opposite mathematics.</p>

<div style="margin:2rem 0; background:#f7f6f4; border-left:3px solid #8b3a1e;">
  <div onclick="var c=this.nextElementSibling,a=this.querySelector('.mod-arrow');c.style.display=c.style.display==='block'?'none':'block';a.textContent=c.style.display==='block'?'▼ collapse':'▶ expand';" style="padding:0.8rem 1.5rem; cursor:pointer; display:flex; align-items:center; justify-content:space-between; user-select:none;">
    <div style="font-size:0.65rem; font-weight:700; text-transform:uppercase; letter-spacing:0.12em; color:#8b3a1e;">The Income Model</div>
    <span class="mod-arrow" style="font-size:0.68rem; color:#8b3a1e; font-weight:700; letter-spacing:0.06em;">▶ expand</span>
  </div>
  <div style="display:none; padding:0 1.5rem 1.2rem;">
    <div style="font-family:'Spectral',serif; font-size:1.15rem; text-align:center; margin:0.6rem 0 1rem; letter-spacing:0.02em; color:#1a1d1e;">
      log(<em>Y</em>) = 0.35 &#183; <em>z</em><sub>IQ</sub> + 0.25 &#183; <em>z</em><sub>C</sub> + 0.45 &#183; <em>z</em><sub>W</sub> + <em>&#949;</em>
    </div>
    <div style="font-size:0.88rem; line-height:1.8; color:#3d4144;">
      <p style="margin:0 0 0.5rem;"><strong><em>Y</em></strong> - household income (log-normally distributed; anchored to a $40k individual income median)</p>
      <p style="margin:0 0 0.5rem;"><strong><em>z</em><sub>IQ</sub></strong> - IQ standardised to mean 0, SD 1. Intelligence is genuinely Gaussian - the sum of thousands of small genetic effects. It enters the equation as a raw z-score. Heritability &#8776; 0.60 (a conservative lower bound for adulthood; adult twin studies typically find 0.65&#8211;0.80); regresses toward the population mean each generation, though the rate of regression is shallower under assortative mating - which is why the AM dynamics in Section IV matter for the long-run trajectory.</p>
      <p style="margin:0 0 0.5rem;"><strong><em>z</em><sub>C</sub></strong> - conscientiousness standardised to mean 0, SD 1. Also approximately Gaussian and heritable (h&#178; &#8776; 0.45). Predicts income through persistence, reliability, and long-horizon planning - independently of IQ.</p>
      <p style="margin:0 0 0.5rem;"><strong><em>z</em><sub>W</sub></strong> - starting wealth, <em>rank-transformed</em> to a z-score via the empirical wealth CDF. Wealth is <em>not</em> Gaussian - it follows a power law, with a mean five times the median. It cannot be treated as a raw z-score. Instead, each person's wealth percentile is mapped through the inverse normal CDF, preserving ordinal position while allowing entry into the linear model. The implication: a one-unit move in <em>z</em><sub>W</sub> near the top of the distribution corresponds to vastly more absolute dollars than the same move near the median. The model is linear in rank; the underlying variable is not.</p>
      <p style="margin:0 0 0;"><strong><em>&#949;</em></strong> - residual noise, N(0, 0.70&#178;). Captures luck, path-dependence, and the enormous individual variation that the three structural variables cannot explain. The model is a skeleton, not a destiny.</p>
    </div>
    <div style="margin-top:0.9rem; font-size:0.8rem; color:#6f777d; font-style:italic;">Coefficients calibrated from Cawley &amp; Heckman (IQ&#8211;income), Nyhus &amp; Pons (conscientiousness&#8211;income), and Chetty et al. 2014 intergenerational wealth elasticity. The IQ coefficient (0.35) is the value that pertained before large-scale AI substitution of cognitive work - Section V argues it is falling. Note that IQ and starting wealth are themselves correlated (r &#8776; 0.35), so in a fully controlled regression the independent contribution of each would be somewhat smaller; these coefficients are calibrated approximations of each factor's empirical association with income, not strict partial effects.</div>
  </div>
</div>

<div style="margin:2rem 0; background:#f7f6f4; border-left:3px solid #1a5c8a;">
  <div onclick="var c=this.nextElementSibling,a=this.querySelector('.mod-arrow');c.style.display=c.style.display==='block'?'none':'block';a.textContent=c.style.display==='block'?'▼ collapse':'▶ expand';" style="padding:0.8rem 1.5rem; cursor:pointer; display:flex; align-items:center; justify-content:space-between; user-select:none;">
    <div style="font-size:0.65rem; font-weight:700; text-transform:uppercase; letter-spacing:0.12em; color:#1a5c8a;">The Wealth Transmission Model</div>
    <span class="mod-arrow" style="font-size:0.68rem; color:#1a5c8a; font-weight:700; letter-spacing:0.06em;">▶ expand</span>
  </div>
  <div style="display:none; padding:0 1.5rem 1.2rem;">
    <div style="font-family:'Spectral',serif; font-size:1.05rem; text-align:center; margin:0.6rem 0 1rem; letter-spacing:0.02em; color:#1a1d1e;">
      <em>W</em><sub>t+1</sub> = &#951; &#183; <em>g</em>(<em>W</em><sub>t</sub>) &#183; <em>W</em><sub>t</sub> + &#957; &#183; <em>s</em>(<em>z</em><sub>IQ</sub>) &#183; <em>Y</em><sub>t</sub> &#183; <em>T</em>
    </div>
    <div style="font-size:0.88rem; line-height:1.8; color:#3d4144;">
      <p style="margin:0 0 0.5rem;"><strong>&#951;</strong> - inheritance fraction (&#8776; 0.85). The legal channel transmits most wealth intact - what does not reach children goes to taxes and dissipation.</p>
      <p style="margin:0 0 0.5rem;"><strong><em>g</em>(<em>W</em><sub>t</sub>)</strong> - capital growth multiplier, <em>threshold-gated</em>:
        <br>&#8195;&#8195;&#8195;&#8195;&#8226; <em>W</em><sub>t</sub> &lt; $1k &nbsp;-&nbsp; <em>g</em> &#8776; 0.85 &nbsp;(debt zone: interest erodes wealth)
        <br>&#8195;&#8195;&#8195;&#8195;&#8226; $1k &#8804; <em>W</em><sub>t</sub> &lt; $20k &nbsp;-&nbsp; <em>g</em> &#8776; 1.0 &nbsp;(subsistence: income consumed month to month; nothing to invest)
        <br>&#8195;&#8195;&#8195;&#8195;&#8226; <em>W</em><sub>t</sub> &#8805; $20k &nbsp;-&nbsp; <em>g</em> &#8776; 1.5 &nbsp;(accumulation: capital appreciates at &#8776;1% real/yr over a 40-year career)
      </p>
      <p style="margin:0 0 0.5rem;"><strong><em>s</em>(<em>z</em><sub>IQ</sub>)</strong> - savings rate, IQ-adjusted: max(0, 0.12 + 0.04 &#183; <em>z</em><sub>IQ</sub>). Higher intelligence predicts lower discount rates, better portfolio decisions, and debt avoidance (Grinblatt et al. 2011; McArdle et al. 2009; Shamosh &amp; Gray 2008). At average IQ the baseline rate is 12%; each standard deviation above adds roughly 4 percentage points. <em>This term is zero below the $20k threshold</em> - you cannot save what you must spend to survive.</p>
      <p style="margin:0 0 0;"><strong>&#957;, <em>T</em></strong> - the fraction of lifetime savings that reaches the child (&#8776; 15%) and the career length (40 years).</p>
    </div>
    <div style="margin-top:0.9rem; font-size:0.8rem; color:#6f777d; font-style:italic;">The $20k threshold is a modelling parameter approximating the 25th&#8211;27th percentile of US net worth (SCF 2022); there is no empirically established precise cutoff. The underlying phenomenon - that below a certain asset floor income is consumed by subsistence and debt service rather than compounding - is well-documented (Sherraden, <em>Assets and the Poor</em>, 1991). The specific dollar figure is a modelling convenience that will date as inflation moves nominal values. Below this floor, the Piketty compounding mechanism - <em>r</em> &gt; <em>g</em> - simply does not operate. Above it, it operates with a force that is independent of traits and depends only on the size of the initial position. This is the real reason the floor matters: not that life at the bottom is harder, but that the mathematics of compound growth are inaccessible from there.</div>
  </div>
</div>

<p>The simulator below lets you test the arithmetic yourself. Three presets tell the essential story. <strong>IQ vs Wealth</strong>: high-IQ at median wealth versus median-IQ at 90th-percentile wealth - notice how close the medians are. <strong>Dynasty</strong>: exceptional traits at low starting wealth versus average traits at top-1% wealth - run it, then set the IQ&#8594;income &#946; to 0.10 to model an AI economy and watch the gap become a chasm. <strong>The Floor</strong>: identical average traits, one group below $20k, one group at comfortable middle class - run it and watch what the threshold does across a generation. Then switch to the dynasty simulation and push the assortative mating slider to 0.9. Watch five generations. That is the prediction this essay makes. The simulator makes it visible.</p>

<div class="viz-widget" style="padding:0;">
  <div style="padding:0.9rem 1rem 0.6rem; border-bottom:1px solid var(--viz-border);">
    <span class="viz-tag">Figure 6 - Interactive Simulation</span>
    <span class="viz-title-text">Traits × Inherited Wealth → Household Income: Build Your Own Comparison</span>
  </div>

  <!-- SIM PANELS -->
  <div style="display:grid; grid-template-columns:1fr 1fr; gap:1px; background:var(--viz-border);">
    <!-- Trait panel -->
    <div style="background:#fff; padding:0.55rem 0.7rem 0.4rem;">
      <div style="font-size:0.65rem; font-weight:700; text-transform:uppercase; letter-spacing:0.15em; color:var(--viz-accent); margin-bottom:0.15rem;">Draw rectangle to select population</div>
      <div style="font-size:0.78rem; font-weight:700; color:#1a1d1e; margin-bottom:0.3rem;">Trait space: IQ × Conscientiousness (ρ = 0.25)</div>
      <canvas id="sim-trait-canvas" width="500" height="380" style="width:100%; display:block; cursor:crosshair;"></canvas>
    </div>
    <!-- Wealth panel -->
    <div style="background:#fff; padding:0.55rem 0.7rem 0.4rem;">
      <div style="font-size:0.65rem; font-weight:700; text-transform:uppercase; letter-spacing:0.15em; color:var(--viz-accent); margin-bottom:0.15rem;">Drag bracket to select wealth range</div>
      <div style="font-size:0.78rem; font-weight:700; color:#1a1d1e; margin-bottom:0.3rem;">Starting net worth (US SCF 2022, log scale)</div>
      <canvas id="sim-wealth-canvas" width="500" height="380" style="width:100%; display:block; cursor:ew-resize;"></canvas>
    </div>
  </div>

  <!-- CONTROLS - NO inline handlers; wired in JS -->
  <div style="background:#f7f6f4; border-top:1px solid var(--viz-border); border-bottom:1px solid var(--viz-border); padding:0.6rem 0.8rem; display:flex; flex-wrap:wrap; gap:0.5rem 1.2rem; align-items:center; font-size:0.8rem; color:#6f777d;">
    <div style="display:flex; align-items:center; gap:0.4rem;">
      <span>Editing:</span>
      <div id="sim-tab-A" style="padding:0.2rem 0.7rem; border-radius:3px; cursor:pointer; font-weight:700; font-size:0.78rem; border:1.5px solid #8b3a1e; background:#8b3a1e; color:white;">Set A</div>
      <div id="sim-tab-B" style="padding:0.2rem 0.7rem; border-radius:3px; cursor:pointer; font-weight:700; font-size:0.78rem; border:1.5px solid #1a5c8a; color:#1a5c8a; background:white;">Set B</div>
    </div>
    <button id="sim-sample-btn" style="padding:0.25rem 0.8rem; border-radius:3px; cursor:pointer; font-weight:700; font-size:0.78rem; background:#1a1d1e; color:white; border:none;">▶ Sample</button>
    <button id="sim-clear-btn" style="padding:0.25rem 0.8rem; border-radius:3px; cursor:pointer; font-size:0.78rem; border:1px solid #f0b0a0; color:#c0391b; background:white;">✕ Clear</button>
    <div style="width:1px; height:22px; background:var(--viz-border);"></div>
    <div style="display:flex; align-items:center; gap:0.4rem; flex-wrap:wrap;">
      <span>Presets:</span>
      <span id="sim-preset-iq" style="padding:0.2rem 0.6rem; border-radius:3px; cursor:pointer; font-size:0.74rem; font-weight:700; border:1px solid var(--viz-border); background:white; color:#6f777d;">IQ vs Wealth</span>
      <span id="sim-preset-dynasty" style="padding:0.2rem 0.6rem; border-radius:3px; cursor:pointer; font-size:0.74rem; font-weight:700; border:1px solid var(--viz-border); background:white; color:#6f777d;">Dynasty</span>
      <span id="sim-preset-floor" style="padding:0.2rem 0.6rem; border-radius:3px; cursor:pointer; font-size:0.74rem; font-weight:700; border:1px solid var(--viz-border); background:white; color:#6f777d;">The Floor</span>
    </div>
    <div style="width:1px; height:22px; background:var(--viz-border);"></div>
    <div style="display:flex; align-items:center; gap:0.4rem;">
      <span>Assortative mating:</span>
      <input type="range" id="sim-am" min="0" max="100" value="70" style="width:90px;">
      <span id="sim-am-val" style="font-weight:700; color:var(--viz-accent); min-width:32px;">0.70</span>
    </div>
    <div style="display:flex; align-items:center; gap:0.4rem;" title="Reduce to model an AI economy where cognitive work is commoditised">
      <span style="color:#8b3a1e; font-weight:700;">IQ→income β:</span>
      <input type="range" id="sim-biq" min="0" max="100" value="35" step="5" style="width:80px;">
      <span id="sim-biq-val" style="font-weight:700; color:#8b3a1e; min-width:32px;">0.35</span>
    </div>
    <div style="display:flex; align-items:center; gap:0.4rem;">
      <span>Generation:</span>
      <div style="display:flex; border:1px solid var(--viz-border); border-radius:3px; overflow:hidden;">
        <button id="sim-gen0" style="padding:0.2rem 0.6rem; font-size:0.74rem; font-weight:700; cursor:pointer; background:#1a1d1e; color:white; border:none; outline:none;">This gen</button>
        <button id="sim-gen1" style="padding:0.2rem 0.6rem; font-size:0.74rem; font-weight:700; cursor:pointer; background:white; color:#6f777d; border:none; outline:none;">Children</button>
      </div>
    </div>
  </div>

  <!-- OUTCOME PANEL -->
  <div style="background:#fff; padding:0.55rem 0.7rem 0.4rem;">
    <div style="font-size:0.65rem; font-weight:700; text-transform:uppercase; letter-spacing:0.15em; color:var(--viz-accent); margin-bottom:0.15rem;">Outcome - Household Income Distribution</div>
    <canvas id="sim-outcome-canvas" width="960" height="240" style="width:100%; display:block;"></canvas>
  </div>

  <!-- STATS BAR -->
  <div id="sim-stats" style="display:flex; flex-wrap:wrap; gap:0.8rem 2rem; padding:0.5rem 0.8rem; background:#f7f6f4; border-top:1px solid var(--viz-border); font-size:0.8rem;">
    <div><div style="font-size:0.65rem; text-transform:uppercase; letter-spacing:0.1em; color:#6f777d;">Set A median</div><div id="sim-stat-a-med" style="font-weight:700; color:#8b3a1e;">-</div></div>
    <div><div style="font-size:0.65rem; text-transform:uppercase; letter-spacing:0.1em; color:#6f777d;">Set A P25–P75</div><div id="sim-stat-a-iqr" style="font-weight:700; color:#8b3a1e;">-</div></div>
    <div><div style="font-size:0.65rem; text-transform:uppercase; letter-spacing:0.1em; color:#6f777d;">Set A P90</div><div id="sim-stat-a-p90" style="font-weight:700; color:#8b3a1e;">-</div></div>
    <div style="width:1px; background:var(--viz-border);"></div>
    <div><div style="font-size:0.65rem; text-transform:uppercase; letter-spacing:0.1em; color:#6f777d;">Set B median</div><div id="sim-stat-b-med" style="font-weight:700; color:#1a5c8a;">-</div></div>
    <div><div style="font-size:0.65rem; text-transform:uppercase; letter-spacing:0.1em; color:#6f777d;">Set B P25–P75</div><div id="sim-stat-b-iqr" style="font-weight:700; color:#1a5c8a;">-</div></div>
    <div><div style="font-size:0.65rem; text-transform:uppercase; letter-spacing:0.1em; color:#6f777d;">Set B P90</div><div id="sim-stat-b-p90" style="font-weight:700; color:#1a5c8a;">-</div></div>
    <div style="width:1px; background:var(--viz-border);"></div>
    <div><div style="font-size:0.65rem; text-transform:uppercase; letter-spacing:0.1em; color:#6f777d;">Difference</div><div id="sim-stat-diff" style="font-weight:700; color:#1a1d1e;">-</div></div>
  </div>

  <div class="viz-caption" style="border-top:none; padding:0.7rem 1rem 0.9rem;">Start with the <strong>IQ vs Wealth</strong> preset - high-IQ/median-wealth vs median-IQ/top-20% wealth. Notice how close the medians are. Switch to <strong>Children</strong> and push assortative mating to 0.9 - watch the legal channel compound undiluted while traits regress. Try <strong>Dynasty</strong> to see exceptional traits vs top-1% wealth head to head. Then try <strong>The Floor</strong>: identical average traits, one group below $20k net worth and one at middle class - below the threshold, savings cannot activate and wealth stagnates or erodes; above it, capital appreciates and IQ boosts the savings rate (see the Wealth Transmission Model above). Model: <em>log(income) = 0.35·IQ<sub>z</sub> + 0.25·consc<sub>z</sub> + 0.45·wealth<sub>z</sub> + ε</em>, anchored to $40k individual income median. Intergenerational wealth elasticity &#8776; 0.45 (Chetty et al., 2014<sup><a href="https://opportunityinsights.org" target="_blank" rel="noopener">15</a></sup>).</div>
</div>

<p>Traits matter enormously in any individual life - the residual variance is large. Two people with identical traits and identical starting wealth will have very different outcomes; the world is noisy, path-dependent, and full of choices the model cannot capture. What the model can say is this: the Gaussian framework alone - the idea that human advantage is primarily a biological story - leaves the second inheritance system out of the picture entirely. And that system, being legally constructed rather than biologically transmitted, is in principle alterable in ways the biological one is not.</p>

<p>As assortative mating intensifies, the two inheritance systems are becoming concentrated in the same families. The mathematical rules do not change: IQ still regresses toward the mean, wealth still compounds - but the households running both clocks simultaneously are becoming a smaller, more self-contained group. The share of Americans in middle-income households has fallen from 61% in 1971 to 51% in 2023, declining in each decade, while upper-income families were the only tier to grow median wealth from 2001 to 2016 - adding 33% while middle-income families lost 20%.</p>

<p>The simulation below runs this forward. Place a founding couple, set their starting traits and wealth, then run five generations. Watch what regresses toward the mean - and what does not.</p>

<div class="viz-widget" style="padding:0;">
  <div style="padding:0.9rem 1rem 0.6rem; border-bottom:1px solid var(--viz-border);">
    <span class="viz-tag">Figure 7 - Interactive Simulation</span>
    <span class="viz-title-text">Family Dynasty: Five Generations of Traits and Wealth</span>
  </div>

  <!-- TWO CANVAS PANELS -->
  <div style="display:grid; grid-template-columns:1fr 1fr; gap:1px; background:var(--viz-border);">
    <div style="background:#fff; padding:0.55rem 0.7rem 0.4rem;">
      <div style="font-size:0.65rem; font-weight:700; text-transform:uppercase; letter-spacing:0.15em; color:var(--viz-accent); margin-bottom:0.15rem;">Click or drag to position each founder</div>
      <div style="font-size:0.78rem; font-weight:700; color:#1a1d1e; margin-bottom:0.3rem;">Trait space: IQ × Conscientiousness (ρ = 0.25)</div>
      <canvas id="f7-trait-canvas" width="500" height="380" style="width:100%; display:block; cursor:crosshair;"></canvas>
    </div>
    <div style="background:#fff; padding:0.55rem 0.7rem 0.4rem;">
      <div style="font-size:0.65rem; font-weight:700; text-transform:uppercase; letter-spacing:0.15em; color:var(--viz-accent); margin-bottom:0.15rem;">Drag to set each founder's starting wealth</div>
      <div style="font-size:0.78rem; font-weight:700; color:#1a1d1e; margin-bottom:0.3rem;">Starting net worth (US SCF 2022, log scale)</div>
      <canvas id="f7-wealth-canvas" width="500" height="380" style="width:100%; display:block; cursor:ew-resize;"></canvas>
    </div>
  </div>

  <!-- CONTROLS -->
  <div style="background:#f7f6f4; border-top:1px solid var(--viz-border); border-bottom:1px solid var(--viz-border); padding:0.6rem 0.8rem; display:flex; flex-wrap:wrap; gap:0.5rem 1.2rem; align-items:center; font-size:0.8rem; color:#6f777d;">
    <div style="display:flex; align-items:center; gap:0.4rem;">
      <span>Editing:</span>
      <div id="f7-person-a" style="padding:0.2rem 0.7rem; border-radius:3px; cursor:pointer; font-weight:700; font-size:0.78rem; border:1.5px solid #8b3a1e; background:#8b3a1e; color:white;">Founder A</div>
      <div id="f7-person-b" style="padding:0.2rem 0.7rem; border-radius:3px; cursor:pointer; font-weight:700; font-size:0.78rem; border:1.5px solid #1a5c8a; color:#1a5c8a; background:white;">Founder B</div>
    </div>
    <button id="f7-sim-btn" style="padding:0.25rem 0.8rem; border-radius:3px; cursor:pointer; font-weight:700; font-size:0.78rem; background:#1a1d1e; color:white; border:none;">▶ Simulate</button>
    <button id="f7-reset-btn" style="padding:0.25rem 0.8rem; border-radius:3px; cursor:pointer; font-size:0.78rem; border:1px solid #f0b0a0; color:#c0391b; background:white;">↩ Reset</button>
    <div style="width:1px; height:22px; background:var(--viz-border);"></div>
    <div style="display:flex; align-items:center; gap:0.4rem;">
      <span>Kids/couple:</span>
      <input type="range" id="f7-kids" min="10" max="50" value="20" step="5" style="width:80px;">
      <span id="f7-kids-val" style="font-weight:700; color:var(--viz-accent); min-width:28px;">2.0</span>
    </div>
    <div style="display:flex; align-items:center; gap:0.4rem;">
      <span>Assortative mating:</span>
      <input type="range" id="f7-am" min="0" max="100" value="70" style="width:90px;">
      <span id="f7-am-val" style="font-weight:700; color:var(--viz-accent); min-width:32px;">0.70</span>
    </div>
    <div style="display:flex; align-items:center; gap:0.4rem;" title="Reduce to model an AI economy where cognitive work is commoditised">
      <span style="color:#8b3a1e; font-weight:700;">IQ→income β:</span>
      <input type="range" id="f7-biq" min="0" max="100" value="35" step="5" style="width:80px;">
      <span id="f7-biq-val" style="font-weight:700; color:#8b3a1e; min-width:32px;">0.35</span>
    </div>
  </div>

  <!-- INCOME JOY-PLOT PANEL -->
  <div style="background:#fff; padding:0.55rem 0.7rem 0.4rem; border-bottom:1px solid var(--viz-border);">
    <div style="font-size:0.65rem; font-weight:700; text-transform:uppercase; letter-spacing:0.15em; color:var(--viz-accent); margin-bottom:0.15rem;">Outcome - Household Income by Generation</div>
    <canvas id="f7-gen-canvas" width="960" height="300" style="width:100%; display:block;"></canvas>
  </div>
  <!-- WEALTH JOY-PLOT PANEL -->
  <div style="background:#fff; padding:0.55rem 0.7rem 0.4rem;">
    <div style="font-size:0.65rem; font-weight:700; text-transform:uppercase; letter-spacing:0.15em; color:var(--viz-accent); margin-bottom:0.15rem;">Outcome - Household Wealth by Generation <span style="font-weight:400; color:#888; font-size:0.6rem; text-transform:none; letter-spacing:0;">(log scale - this is the real story)</span></div>
    <canvas id="f7-wealth-joy-canvas" width="960" height="300" style="width:100%; display:block;"></canvas>
  </div>

  <!-- STATS TABLE -->
  <div style="padding:0.5rem 0.8rem; background:#f7f6f4; border-top:1px solid var(--viz-border); overflow-x:auto;">
    <table style="font-size:0.78rem; border-collapse:collapse; width:100%; min-width:480px;">
      <thead>
        <tr style="border-bottom:1px solid var(--viz-border); color:#6f777d; text-transform:uppercase; letter-spacing:0.08em; font-size:0.65rem;">
          <th style="text-align:left; padding:0.3rem 0.6rem;">Generation</th>
          <th style="text-align:right; padding:0.3rem 0.6rem;">People</th>
          <th style="text-align:right; padding:0.3rem 0.6rem;">Median income</th>
          <th style="text-align:right; padding:0.3rem 0.6rem;">Median wealth</th>
          <th style="text-align:right; padding:0.3rem 0.6rem;">Avg IQ</th>
        </tr>
      </thead>
      <tbody id="f7-stats-body">
        <tr><td colspan="5" style="text-align:center; color:#aab; padding:0.6rem; font-style:italic;">Run the simulation to see results</td></tr>
      </tbody>
    </table>
  </div>

  <div class="viz-caption" style="border-top:none; padding:0.7rem 1rem 0.9rem;">Place <strong>Founder A</strong> (terracotta) and <strong>Founder B</strong> (blue) by clicking or dragging in both canvases, then click <strong>&#9654; Simulate</strong>. Biological traits regress each generation - IQ heritability &#8776; 0.60, conscientiousness &#8776; 0.45. Wealth transmission is threshold-gated: below $1k it erodes (debt interest); below $20k it stagnates (income consumed by subsistence, savings blocked); above $20k it compounds at 1.5&#215; and savings scale with IQ. Try both founders at low wealth ($5&#8211;10k) to see the threshold trap. Then try <em>IQ&#8594;income &#946;</em> at 0.10 (AI economy): trait advantage collapses while starting wealth determines everything.</div>
</div>

<div class="ornament">· · ·</div>

<span class="section-marker">IV - The Coefficients Are Changing</span>

<h2>Phase 3</h2>

<p>For most of human history, the wire connecting cognitive ability to economic advancement did not exist. Before the bourgeois revolutions of the late eighteenth century, intelligence was a survival tool within your caste, not an engine of mobility between them. A peasant born with an exceptional mind had no mechanism to convert that endowment into heritable wealth - the channels ran separately, and by law. Wealth transmitted through blood and title. Traits recirculated within class.</p>

<p>The French Revolution, industrial capitalism, and the credential systems of the nineteenth and twentieth centuries built a bridge. Gregory Clark's surname-tracking research shows that measured mobility rates remained roughly constant across regimes - what changed was the mechanism. For the first time at scale, cognitive ability could be converted into credentials, and credentials into heritable wealth. The two inheritance channels began to couple. The meritocracy was always imperfect - the bell curve and the power law were never fully joined - but the bridge existed, and it changed who the locked-in class was. What ended Phase 1 matters. Not a change in the distribution of human traits - the peasants of 1789 were not more intelligent than the peasants of 1689. What changed was the legal architecture: the abolition of feudal title, the creation of property rights accessible to non-aristocrats, the establishment of credit markets that allowed cognitive ability to be capitalised. The bridge was not a natural phenomenon. It was words. Which means it can be unwritten with new ones.</p>

<p>Artificial intelligence is dismantling that bridge. The question is not whether this is happening - the productivity substitution data is unambiguous. The question is what it resembles, historically, when the cognitive-work premium collapses and the conversion mechanism shuts down. The answer is uncomfortable: it resembles Phase 1. This is not a distant prediction. The coefficient is already moving. The evidence is already accumulating. Overall programmer employment in the US fell 27.5% between 2023 and 2025. Entry-level tech hiring at the largest companies has halved since 2022. Capital returns, meanwhile, are outpacing wage growth by a margin JP Morgan describes plainly as "capital-heavy growth beating payroll growth - the AI buildout is heavy investment in data centers and equipment, not a hiring surge." The repricing is not a prediction. It is a present-tense observation.</p>

<h2>The first wave</h2>

<p>The income model from Section III reads: <em>log(income) = 0.35·IQ + 0.25·conscientiousness + 0.45·wealth + ε</em>. That IQ coefficient of 0.35 is a historical artefact. It reflects a century of industrialised economies that were willing to pay a premium for cognitive work precisely because cognitive work was scarce. The thing that made a high-IQ person economically exceptional was simple: they could do cognitive tasks faster, better, and more reliably than others. That scarcity is ending. Not at the margins, over decades. Rapidly, at the core, right now.</p>

<p>Large language models already match or exceed median professional performance on the routine, high-volume tasks that constitute a significant fraction of professional billing hours across legal research, financial analysis, diagnostic triage, software engineering, and content production. This is not a prediction about the 2030s. It is a description of 2026. The junior lawyer billing for research that a model now does in seconds is not being made more productive. They are being made unnecessary. The management consultant producing slide decks at 2am, the analyst building Excel models from scratch, the radiologist triaging routine scans - these are not jobs being augmented. They are jobs being substituted. What remains is judgment, client relationships, and embodied accountability - a shrinking, less compensated fraction. The distinction matters enormously for what happens to &#946;<sub>IQ</sub> in the next decade. Andrej Karpathy's <a href="https://karpathy.ai/jobs/" target="_blank" rel="noopener">AI job-exposure visualiser</a> - mapping 342 occupations across twelve major categories - puts software engineers, data analysts, paralegals, and translators all at 8&#8211;9 out of 10 on the exposure scale. The roles anchoring the low end are roofers, plumbers, and electricians - defined precisely by their physical irreducibility. That is not a coincidence. It is the shape of Wave 1.</p>

<div class="aside">
  <strong>What about the Jevons paradox?</strong>
The standard reassurance at this point is Jevons: cheaper cognitive work will unlock latent demand, expand the total market for knowledge services, and create new categories of work we cannot currently predict. This is probably partly true - there is enormous suppressed demand for legal advice, medical consultation, and financial analysis that lower prices will release, and the total volume of AI-augmented knowledge work will almost certainly expand. But the Jevons argument has a binding constraint it cannot escape: human attention is fixed and purchasing power grows at a few percent per year, while AI capability is not growing at a few percent per year. The surplus from the expansion - the productivity gain from doing 10x the cognitive work at 1/10th the price - accrues primarily to whoever owns the models, not to the workers producing the output at compressed wages. And even if the Jevons expansion eventually generates new categories of work that reabsorb the displaced, the transition is happening within single career lifespans rather than across generations - the adjustment burden falls on people who need to eat now, not on their grandchildren entering a new equilibrium. The expansion is real. The wages the expansion generates, and the speed at which they arrive, are not.
</div>

<p>If cognitive work can be purchased at near-zero marginal cost from a model running on a data centre, the premium for human cognitive ability collapses toward the premium for anything else that can be purchased cheaply. The coefficient &#946;<sub>IQ</sub> does not fall to zero - human judgment, embodied presence, and genuine creativity retain value - but it falls substantially. A plausible trajectory over the next fifteen years puts it somewhere between 0.10 and 0.20. The Gaussian bell curve of IQ does not move. The trait is still there, still real, still heritable, still normally distributed across the population. What changes is how much the economy rewards it.</p>

<blockquote>
  <p>The coming disruption does not flatten the bell curve. It severs the wire connecting the bell curve to the income distribution.</p>
</blockquote>


<p>But the model contains one asymmetry that points in the opposite direction, and it is time-limited enough that naming it plainly is urgent. The transition from a world where cognitive work commands a premium to a world where AI does cognitive work cheaply is not instantaneous. It is a decade-long repricing. And repricing events create arbitrage windows.</p>

<p>The arbitrage here is specific. AI tools now exist that can dramatically amplify the output of a domain expert - a nurse, a structural engineer, a logistics manager, a teacher, a lawyer, a radiologist - who understands both their domain deeply and what the tools can and cannot reliably do. That combination is currently scarce. It will not remain scarce. As the integration matures, as workflows standardise, as vendors commoditise the implementation, the premium for being early will compress toward zero. But the window is open now, probably for five to seven more years in most domains, and the economics during that window are extraordinary. The people who build companies at that intersection - who take a decade of domain knowledge and apply it to AI integration before the market has priced it - are capturing a transition premium that is, for this brief period, not gated by inherited wealth. It is gated by speed, domain depth, and the willingness to act before the outcome is obvious. Those are things a person with cognitive ability and modest starting wealth can actually have.</p>
<blockquote>
<p>The model says the window closes. It also says the window is open now. That distinction is the most important thing in this essay for anyone who is not already in the top tier of capital ownership. The bridge is being pulled up. You have roughly five to ten years to cross it.</p>
</blockquote>


<div class="viz-widget" id="f8-widget" style="padding:0;">
  <div style="padding:0.9rem 1rem 0.6rem; border-bottom:1px solid var(--viz-border);">
    <span class="viz-tag">Figure 8 - Interactive Simulation</span>
    <span class="viz-title-text">The Repricing: When Does Wealth Overtake Intelligence?</span>
  </div>
  <div style="background:#f7f6f4; border-bottom:1px solid var(--viz-border); padding:0.6rem 0.8rem; display:flex; flex-wrap:wrap; gap:0.5rem 1.4rem; align-items:center; font-size:0.8rem; color:#6f777d;">
    <div style="display:flex; align-items:center; gap:0.6rem;">
      <span style="font-weight:700; color:#8b3a1e;">AI adoption speed:</span>
      <span style="font-size:0.72rem; color:#6f777d;">Slow</span>
      <input type="range" id="f8-speed" min="0" max="100" value="50" step="1" style="width:140px;">
      <span style="font-size:0.72rem; color:#6f777d;">Fast</span>
    </div>
    <div id="f8-speed-label" style="font-weight:700; color:#1a1d1e; font-size:0.82rem;">Medium</div>
  </div>
  <div style="background:#fff; padding:0.4rem 0.6rem 0.2rem;">
    <canvas id="f8-canvas" width="960" height="420" style="width:100%; display:block;"></canvas>
  </div>
  <div style="display:flex; flex-wrap:wrap; gap:0.8rem 2.5rem; padding:0.45rem 0.9rem; background:#f7f6f4; border-top:1px solid var(--viz-border); font-size:0.8rem;">
    <div>
      <div style="font-size:0.63rem; text-transform:uppercase; letter-spacing:0.1em; color:#6f777d;">Crossing year</div>
      <div id="f8-crossing-year" style="font-weight:700; color:#8b3a1e;">-</div>
    </div>
    <div>
      <div style="font-size:0.63rem; text-transform:uppercase; letter-spacing:0.1em; color:#6f777d;">Window remaining (from now)</div>
      <div id="f8-window-years" style="font-weight:700; color:#8b3a1e;">-</div>
    </div>
    <div>
      <div style="font-size:0.63rem; text-transform:uppercase; letter-spacing:0.1em; color:#6f777d;">Income gap at 2040 (B over A)</div>
      <div id="f8-gap-2040" style="font-weight:700; color:#1a5c8a;">-</div>
    </div>
  </div>
  <div class="viz-caption" style="border-top:none; padding:0.7rem 1rem 0.9rem;">
    <strong>Archetype A</strong> (terracotta): IQ at the 93rd percentile, median starting wealth.
    <strong>Archetype B</strong> (blue): median IQ, wealth at the top quintile.
    At 2026 coefficients A earns more. As the IQ&#8594;income coefficient falls and the wealth coefficient rises, the lines cross - in every scenario. Drag the speed slider to move the crossing year. The <span style="background:#f5e6d0; padding:0 3px; border-radius:2px;">shaded window</span> is the period during which A can still outperform B - and therefore the period during which cognitive ability can still be converted into heritable capital at a premium. At Fast adoption it is already nearly closed.
  </div>
</div>

<h2>The second wave</h2>
<p>What AI cannot yet do is physical. It cannot fix your boiler, navigate a building site, insert a catheter, or sit with a dying person. These roles require embodied presence that robotic systems cannot yet reliably replicate - and that lag creates a transitional window that looks superficially like equalisation. The paralegal and the radiologist fall toward the income of the skilled tradesperson. The Gini coefficient within the bottom ninety percent compresses. This gets described as AI democratising opportunity. It is more accurately described as AI levelling down the professional-managerial class while the top 0.1% diverges faster than ever. Economists have a name for this pattern: the K-shaped economy - a distribution that splits rather than shifts, upper arm rising, lower arm falling.<sup><a href="https://www.bls.gov/osmr/research-papers/2021/pdf/ec210020.pdf" target="_blank" rel="noopener">21</a></sup></p>

<p>The framing of physical work as shelter from the first wave already understates what is happening. Automation of physical labour is not approaching - it has been under way for a decade, operating at a scale that would unsettle anyone who had not visited a modern fulfilment centre or factory floor recently. The International Federation of Robotics reports that global manufacturing robot density doubled in seven years, from 74 units per ten thousand employees in 2016 to 162 in 2023, with 542,000 new industrial robots installed globally in 2024 alone and a worldwide operational stock now exceeding 4.66 million.<sup><a href="https://ifr.org/ifr-press-releases/news/global-robot-demand-in-factories-doubles-over-10-years" target="_blank" rel="noopener">22</a></sup> Amazon runs over one million robots across its fulfilment centres. These numbers are not projections. They describe the current state of the spaces that package your deliveries and manufacture your goods. Most people have not registered this because automated spaces are not yet part of their visible daily lives. When robotic systems cross the threshold into the domains that are - the care home, the building site, the delivery van, the high street - the adjustment will not feel gradual. The infrastructure will have been built long before the visibility arrives.</p>


<p>The investment community has priced this in. In the first seven months of 2025 alone, robotics startups raised over $6 billion - more than the entirety of 2024 - with capital from Nvidia, Amazon, Sequoia, and Andreessen Horowitz.<sup><a href="https://roboticsandautomationnews.com/2025/12/21/venture-capital-and-private-equity-in-robotics-where-is-the-smart-money-going/97794/" target="_blank" rel="noopener">23</a></sup> Elon Musk has described the humanoid robot as &#8220;the biggest product in history&#8221; and is retooling Tesla's Fremont factory to produce Optimus units at scale, targeting public sales by end-2027 at $20&#8211;30,000 a unit. The economic logic is not obscure: a general-purpose robot that performs the full range of tasks currently requiring a human worker, produced at consumer-electronics scale, captures a labour share of global GDP that currently runs to tens of trillions of dollars annually - not for the worker, but for the company that builds the robot. This is Phase 1 restated in silicon and servos. The mechanism of value extraction is updated; the beneficiaries are the same class as always - those who own the means of production rather than those who constitute it.</p>

<h2>Gasping for air between two waves</h2>

<p>The more important point is economic rather than temporal. Physical jobs - construction, care work, manufacturing, logistics - have never been the low-capital path to heritable wealth. They were the survival floor: income sufficient to live on, but structurally insufficient to generate the capital surplus that clears the asset floor and enters the compounding tier. The knowledge-work premium mattered precisely because it was the route where cognitive ability could generate income large enough to begin that compounding process. A care worker's income, however indispensable the role, has not historically done this. When AI removes the knowledge-work route and robotics eventually removes the physical-work income floor, the remaining path to capital accumulation for people without inherited wealth is not narrowed. It is closed. The two waves do not arrive simultaneously - the AI wave is cresting now, the robotics wave is building - but they are running on the same current. The combined timeline extends the consolidation window from a single decade to perhaps two or three.</p>

<p>The naive reading of Wave 1 produces a false reassurance. Physical and care workers are not immediately displaced by AI - their jobs require embodied presence that current systems cannot replicate. But the protection is exactly one generation deep. The classical mobility pathway out of physical work does not run directly from boilersuit to boardroom. It runs through a middle tier: manual labour first, then - with some savings, a community college course, the right employer - entry-level knowledge work, then professional income, then eventually enough surplus to cross the asset floor and begin compounding. Data entry, basic paralegal research, administrative coordination, junior accounting, entry-level software testing: these roles were never prestigious, but they were the rungs. They were accessible without an elite credential, payable at a living wage, and close enough to professional work that they taught the skills and built the networks that permitted further climbing. These are precisely the roles that AI automates first. The plumber&#8217;s job survives Wave 1. The first-rung knowledge job that the plumber&#8217;s child would have taken on the way out does not. The ladder is not being pulled up from the top. It is being disassembled from the middle, while the families who most need it are still on the bottom rung.</p>


<p>The lawyer billing for work a model now does in seconds does not become wealthier. The analyst whose edge was processing information faster loses that edge. The knowledge-economy tier flattens. This is not experienced as equalisation. It is experienced as loss.</p>

<p>And it is not equalisation in any sense that matters. The compression within the bottom ninety percent does not create new entrants at the top - it reshuffles the middle while the top diverges. UBI and aggressive capital taxation can compress from both ends, but neither creates dynastic wealth for people starting without it. The only route to the compounding tier is to accumulate capital before the transition completes.</p>

<p>As &#946;<sub>IQ</sub> falls, &#946;<sub>W</sub> rises. The productivity gains from AI accrue disproportionately to the shareholders of the companies that  and the infrastructure they run on - not to the workers whose labour they replace. This is not a prediction; it is the observed pattern of every prior capital-for-labour substitution at scale. Piketty's r > g becomes r >> g when AI-driven productivity compounds into capital returns at the current rate. &#946;<sub>W</sub>, already the dominant coefficient at 0.45, plausibly rises toward 0.65. The multiplication still holds - but now one factor dominates almost entirely.</p>

<p>Run this through the simulators. In Figure 6, set the IQ→income β to 0.10 - the AI economy scenario - and load the Dynasty preset. The gap between exceptional traits at low wealth and average traits at high wealth, already uncomfortable at default coefficients, becomes dramatic. Then load The Floor: with the IQ premium collapsed, the high-IQ family below the asset floor loses on both axes simultaneously - income premium gone, savings channel blocked. The threshold trap closes from both sides.</p>

<p>Then go to Figure 9. Set your IQ percentile high, your net worth low, and your AI readiness low. That is the position the essay is describing: cognitive ability that the old model rewarded, capital the old model would have built toward, and a transition already underway that is repricing the first while accelerating the second. Now move AI readiness to high. That gap - between the two runs - is what the window is worth, in dollars, while it remains open.</p>

<h2>A world without a bridge </h2>
<p>There is one more turn: the one that connects AI back to the assortative mating argument and closes the loop in the darkest possible way. Assortative mating in the current era sorts primarily by educational credential: people meet at universities, in graduate programmes, in professional networks, and pair with those who share their institutional location. The credential was a rough but functional proxy for the biological lottery - a signal that someone won the IQ draw and acted on it. If AI makes credentials economically meaningless - if a Harvard law degree no longer predicts income when AI does legal research for $20 a month - that sorting signal disappears.</p>

<p>The signal was already thinner than it appeared. Fagereng, Mogstad and R&#248;nning find that individuals assort significantly on pre-marriage wealth (rank correlation &#8776; 0.45&#8211;0.50), independently of education - meaning wealth was always embedded in the sorting mechanism, partially concealed behind the credential that proxied for it.<sup><a href="https://www.nber.org/papers/w29903" target="_blank" rel="noopener">19</a></sup> The downstream consequences of these mating patterns are measurable: Erola and Kilpi-Jakonen document that changes in partnering patterns directly mediate income inequality growth - a finding that survives even in Finland, where redistribution is most aggressive.<sup><a href="https://journals.sagepub.com/doi/10.1177/00016993211004703" target="_blank" rel="noopener">20</a></sup> The credential, it turns out, was wealth&#8217;s legible face. The question is what happens to the sorting when AI strips that face away.</p>

<p>Two futures follow. In the first, assortative mating weakens: without a common credential system to concentrate social mixing, pairing becomes more random across the trait distribution, the two inheritance channels partially decouple, and the dynasty problem stabilises. In the second - and the evidence points here - assortative mating intensifies, but now around wealth directly rather than its credential proxy. In a world where wealth is the dominant predictor of income, wealth-based mate selection becomes more rational than at any prior point in the credential era. The person with capital seeks a partner with capital - not through explicit calculation, but because the signals that carry weight in their social world have shifted from institutional achievement to financial position. The wealth tier, no longer refreshed by talented entrants converting cognitive ability into capital, becomes reproductively self-contained. The dynasty problem becomes the dynasty <em>certainty</em>.</p>

<p>This prediction is specific enough to be falsifiable. Within the next decade: the income share captured by capital will reach levels not seen since before the New Deal. The correlation between professional income and inherited wealth within the same households will increase measurably. Assortative mating will shift measurably toward sorting on net worth directly, as the credential screen loses its signal value. Watch the BLS wage data against S&amp;P 500 earnings-per-share growth. Watch the labour share of GDP. These numbers are published quarterly. If they diverge as predicted - if the wire severs on the timeline the model implies - then the window described above is not a metaphor. It is an arithmetic deadline. The two waves, completing across two to three decades, leave capital ownership as the only durable source of income that does not erode. That is what the model predicts when you set &#946;<sub>IQ</sub> to its AI-economy value and run the dynasty simulator forward five generations without a labour-income floor beneath the starting position.</p>


<p>The argument above is structural. Figure 9 makes it personal. Enter your own position - IQ percentile, wealth percentile, AI readiness score - and the calculator translates the model&#8217;s coefficients into a concrete estimate: your current income under 2026 coefficients, your expected income in the Phase 3 world, and the difference between acting now and waiting. The children&#8217;s table shows the intergenerational consequence of that single decision. The window is not a metaphor for someone at your coordinates. It is a number.</p>

<div class="viz-widget" id="f9-widget" style="padding:0;">
  <div style="padding:0.9rem 1rem 0.6rem; border-bottom:1px solid var(--viz-border);">
    <span class="viz-tag">Figure 9 - Interactive Calculator</span>
    <span class="viz-title-text">Where Are You? Your Position in the Repricing</span>
  </div>
  <div style="background:#f7f6f4; border-bottom:1px solid var(--viz-border); padding:0.7rem 1rem; display:flex; flex-direction:column; gap:0.6rem;">
    <div style="display:flex; align-items:center; gap:0.7rem; flex-wrap:wrap;">
      <span style="font-weight:700; color:#1a1d1e; font-size:0.8rem; min-width:160px;">IQ percentile</span>
      <input type="range" id="f9-iq" min="1" max="99" value="70" step="1" style="width:160px;">
      <span id="f9-iq-label" style="font-weight:700; color:#1a1d1e; font-size:0.82rem; min-width:80px;">70th pct</span>
    </div>
    <div style="display:flex; align-items:center; gap:0.7rem; flex-wrap:wrap;">
      <span style="font-weight:700; color:#1a1d1e; font-size:0.8rem; min-width:160px;">Starting wealth percentile</span>
      <input type="range" id="f9-wealth" min="1" max="99" value="40" step="1" style="width:160px;">
      <span id="f9-wealth-label" style="font-weight:700; color:#1a1d1e; font-size:0.82rem; min-width:80px;">40th pct</span>
    </div>
    <div style="display:flex; flex-direction:column; gap:0.2rem;">
      <div style="display:flex; align-items:center; gap:0.7rem; flex-wrap:wrap;">
        <span style="font-weight:700; color:#1a1d1e; font-size:0.8rem; min-width:160px;">AI readiness</span>
        <input type="range" id="f9-ready" min="0" max="100" value="25" step="1" style="width:160px;">
        <span id="f9-ready-label" style="font-weight:700; color:#8b3a1e; font-size:0.82rem; min-width:80px;">25 / 100</span>
      </div>
      <div style="font-size:0.7rem; color:#9a9fa5; font-style:italic; padding-left:167px;">0 = deep domain expertise, no AI integration &nbsp;&#183;&nbsp; 100 = deep expertise + full AI workflow integration</div>
    </div>
  </div>
  <div style="display:flex; flex-wrap:wrap; gap:0; border-bottom:1px solid var(--viz-border);">
    <div style="flex:1; min-width:160px; padding:0.8rem 1rem; border-right:1px solid var(--viz-border);">
      <div style="font-size:0.63rem; text-transform:uppercase; letter-spacing:0.1em; color:#6f777d;">Current income</div>
      <div id="f9-income-now" style="font-weight:700; font-size:1.3rem; color:#1a1d1e; margin-top:0.2rem;">-</div>
      <div style="font-size:0.72rem; color:#9a9fa5;">per year, 2026 model</div>
    </div>
    <div style="flex:1; min-width:160px; padding:0.8rem 1rem; border-right:1px solid var(--viz-border);">
      <div style="font-size:0.63rem; text-transform:uppercase; letter-spacing:0.1em; color:#6f777d;">AI-world income</div>
      <div id="f9-income-ai" style="font-weight:700; font-size:1.3rem; color:#1a1d1e; margin-top:0.2rem;">-</div>
      <div id="f9-income-ai-note" style="font-size:0.72rem; color:#9a9fa5;">per year, Phase 3 model</div>
    </div>
    <div style="flex:1; min-width:160px; padding:0.8rem 1rem;">
      <div style="font-size:0.63rem; text-transform:uppercase; letter-spacing:0.1em; color:#6f777d;">Your window opportunity</div>
      <div id="f9-opportunity" style="font-weight:700; font-size:1.1rem; color:#8b3a1e; margin-top:0.2rem; line-height:1.3;">-</div>
      <div style="font-size:0.72rem; color:#9a9fa5;">acting now vs staying put</div>
    </div>
  </div>
  <div style="padding:0.7rem 1rem 0.5rem; background:#fff;">
    <div style="font-size:0.72rem; font-weight:700; color:#555; text-transform:uppercase; letter-spacing:0.08em; margin-bottom:0.5rem;">Your children's expected position (one child, AI-world coefficients)</div>
    <table style="width:100%; border-collapse:collapse; font-size:0.8rem;">
      <thead>
        <tr style="border-bottom:1px solid #e0e0e0;">
          <th style="text-align:left; padding:0.3rem 0.5rem 0.3rem 0; color:#6f777d; font-weight:600;">Scenario</th>
          <th style="text-align:left; padding:0.3rem 0.5rem; color:#6f777d; font-weight:600;">Starting wealth</th>
          <th style="text-align:left; padding:0.3rem 0.5rem; color:#6f777d; font-weight:600;">Compounding tier</th>
          <th style="text-align:left; padding:0.3rem 0; color:#6f777d; font-weight:600;">AI-world income</th>
        </tr>
      </thead>
      <tbody>
        <tr style="border-bottom:1px solid #f0f0f0;">
          <td style="padding:0.4rem 0.5rem 0.4rem 0; font-weight:700; color:#1a5c8a;">If you act now</td>
          <td id="f9-child-act-wealth" style="padding:0.4rem 0.5rem;">-</td>
          <td id="f9-child-act-tier" style="padding:0.4rem 0.5rem;">-</td>
          <td id="f9-child-act-income" style="padding:0.4rem 0; font-weight:700;">-</td>
        </tr>
        <tr>
          <td style="padding:0.4rem 0.5rem 0.4rem 0; font-weight:700; color:#8b3a1e;">If you don't act</td>
          <td id="f9-child-no-wealth" style="padding:0.4rem 0.5rem;">-</td>
          <td id="f9-child-no-tier" style="padding:0.4rem 0.5rem;">-</td>
          <td id="f9-child-no-income" style="padding:0.4rem 0; font-weight:700;">-</td>
        </tr>
      </tbody>
    </table>
    <div style="font-size:0.68rem; color:#9a9fa5; margin-top:0.35rem; font-style:italic;">Assumes one child, 50% wealth transfer, IQ regression to mean (child's z&nbsp;=&nbsp;0.5&nbsp;&#215;&nbsp;parent's z), Phase 3 income coefficients.</div>
  </div>
  <div class="viz-caption" style="border-top:1px solid var(--viz-border); padding:0.7rem 1rem 0.9rem;">
    Move the sliders to your own position. <strong>AI-world income</strong> uses the Phase 3 coefficients (&#946;<sub>IQ</sub>&nbsp;=&nbsp;0.10, &#946;<sub>W</sub>&nbsp;=&nbsp;0.65) from Figure&nbsp;8 - the destination, not the current state. <strong>Window opportunity</strong> is the lifetime income difference between acting now (readiness&nbsp;&#8594;&nbsp;80) versus staying at your current readiness, expressed as total income and estimated wealth accumulation at a 20% savings rate over the 6-year window. The <strong>children's table</strong> shows the intergenerational impact of that single decision, with the $20k compounding threshold marking the boundary between the two inheritance systems described in Section&nbsp;V.
  </div>
</div>

<p>It is worth noting what ended Phase 1 the first time. Not biology. Not the gradual natural regression of aristocratic traits toward the mean - though that happened too. What ended it was law. Specifically: enough people understanding precisely which words in which documents were maintaining the structure, and rewriting them. The French Revolution was not a mood. It was a legal event. The question Phase 3 forces is whether the political will exists to write new words before the concentration becomes self-reinforcing enough to capture the legislative process itself - which is, historically, what sufficiently concentrated wealth eventually does. The window for that is also closing. These two windows - the economic one and the political one - are running on roughly the same clock.</p>


<span class="section-marker">V - The Letter</span>

<h2>What you tell your children</h2>


<p>You tell them this: the world is not random, but it runs on not one lottery but two - with different mathematics, different timescales, and different moral implications. Most people conflate them. The conflation is not innocent: it allows those who won both to treat their position as purely earned, and it prevents those who lost one from understanding which part of their situation is alterable. Understanding the difference is one of the more useful things a person can carry through a life. So let's be precise.</p>
<p>The first lottery is biological. It transmits through chromosomes - stochastic, noisy, self-averaging. The exceptional child of exceptional parents will, on average, be somewhat less exceptional. Not because talent disappears, but because nature shuffles the deck at every generation. The biological gift arrives with a kind of built-in humility: it tends, over time, to share itself out.</p>
<p>The second lottery is legal. It transmits through property law - wills, trusts, the step-up in basis at death, the alumni network that opens doors three generations after the original donor. This gift does not shuffle. It does not dilute. It compounds. A trust fund passed to a child is worth more than the one received, not less. There is no meiosis for money.</p>
<p>If you were fortunate in both lotteries, the humility each demands is different in kind. The biological gift asks for lightness - an acknowledgment that your intelligence is partly climate - something you were born into, not something you made. The legal gift asks for something harder: a reckoning with power, and with the specific machinery that keeps it compounding while you sleep. These are not the same discomfort. One is philosophical. The other is political.</p>

<blockquote>
  <p>Fortune is not a possession. It is a velocity - and its direction is set partly by which lottery you won, and partly by which clock is doing most of the work.</p>
</blockquote>

<p>And so: something is owed. Not guilt - guilt is useless, it performs discomfort without producing change. Not conspicuous humility, which is its own kind of status game. What is owed is seriousness - the specific, unglamorous, long-horizon seriousness of someone who has been handed resources and actually knows it. Find the intersection of what you are capable of and what the world needs, and work there with everything you have. Not as a side project. As a commitment. The biological lottery gave you a head start that will dilute with time. The legal lottery gave you a head start that will compound. Compound interest on inherited advantage demands compound interest on purpose. That is the exchange.</p>

<p>Tell them the part none of the generation before theirs was told clearly. The bridge between the biological lottery and the legal one - credentials, income, heritable capital - is being pulled up in real time. Not as a background condition they'll grow up into. Now. During the years when they're deciding what to build and who to become. Right now there is still a premium for people who understand both a domain and the tools remaking it. That premium is not gated by inheritance. It is gated by speed and seriousness. The window is five to ten years. After it closes, the legal clock runs alone. Both levers matter - the personal and the political. Build something in the window. And advocate, loudly, for the inheritance laws that determine what the world looks like after it closes. One is a ten-year clock. The other is generational. Both are running.</p>

<p>And when they feel they have been dealt a short hand - and they will feel this, because everyone does - give them two correctives, not one.</p>

<p>The first: they are almost certainly not as disadvantaged as they feel, relative to their contemporaries, once they account for all the dimensions they cannot easily see. The short hand rarely contains every card. There are forms of excellence - in reliability, in depth of feeling, in the willingness to remain present when the situation demands nothing and offers nothing - that do not load heavily on any general factor, that are not predicted by IQ, and that the world rewards more than it admits. The dimensionality of a human life exceeds what any correlation matrix can contain.</p>

<p>The second is historical. There have been, by reasonable estimate, around a hundred billion human beings who lived before anyone now alive. Almost all of them toiled against cold, hunger, disease, and the casual violence of political systems that treated most people as instruments rather than ends. A peasant in fourteenth-century France had no access to antibiotics, to education, to the compound interest on centuries of accumulated knowledge that any literate person in the modern world inherits for free. A woman in almost any century before this one had her legal personhood extinguished upon marriage. A child in an eighteenth-century textile mill worked fourteen hours a day in the dark. The short stick of today - in most of the modern world, for most people - is longer than the long stick of most of human history. And critically: part of what made the present possible was that some of those hundred billion people pushed, slowly and painfully and often without reward, against the legal structures that governed their time. The short-hand position is not merely a starting point. It is also, for those who can bear it, a vocation.</p>

<blockquote>
  <p>Even a modest position in today's distribution places you in the outermost tail of the distribution across all of human time. That is not a reason to be satisfied with injustice. It is a reason to be, underneath everything else, quietly astonished - and to do something worthy of the astonishment.</p>
</blockquote>

<p>And tell them something harder. If their own position is above the floor, the window argument applies to them directly. But for families below it, the logic is crueller. AI won't touch their jobs for a while. The plumber is fine. The nurse is fine. But the jobs their kids would have used to climb - the junior admin role, the data entry job, the entry-level legal assistant - those are gone first. The ladder gets removed one generation before the people who needed it were old enough to climb it. By the time the robots arrive for the physical jobs, the route up will already be closed.</p>

<p>Don't respond to any of this with bitterness. Bitterness is just envy with nowhere to go. And don't respond with despair either - despair is what happens when you mistake a description of the situation for a verdict on your life. The situation is real. The math is real. But the person who looks like they failed often didn't fail - they started somewhere the game was rigged against them, and the rigging was so well designed that it looked like their own choices. Debt charges interest whether you understand compound interest or not. The right accent opens the right doors whether anyone admits it or not. Not being able to afford the unpaid internship that leads to the paid job is a structural problem, not a character flaw. Recognising that in other people isn't softness. It's just seeing clearly.</p>

<p>No model captures everything. Most things which make a life worth living don't appear in any of it. They're not in the Gaussian, not in the power law, not transmitted by chromosome or property law. True love, deep friendship, the awe that hits you in front of a mountain or a painting or a piece of music, travel, the single-minded pursuit of a hobby nobody else understands. These move through the world by different rules entirely. Stubbornly, persistently present, woven through the fabric of a life regardless of where it started.
</p>

<p>That is where a great life actually lives. Outside of any model, available to us all.</p>


<div class="aside" style="margin-top:3rem;">
  <strong>References</strong>
  <ol style="margin:0.4rem 0 0; padding-left:1.4rem; font-style:normal; font-size:0.83rem; line-height:1.8; color:#6f777d;">
    <li id="ref1">Spearman, C. (1904). "General Intelligence," Objectively Determined and Measured. <em>American Journal of Psychology</em>. See also: <a href="https://en.wikipedia.org/wiki/G_factor_(psychometrics)" target="_blank" rel="noopener">Wikipedia: g factor (psychometrics)</a>.</li>
    <li id="ref2">Carroll, J.B. (1993). <em>Human Cognitive Abilities: A Survey of Factor-Analytic Studies</em>. Cambridge University Press. <a href="https://en.wikipedia.org/wiki/Human_Cognitive_Abilities" target="_blank" rel="noopener">Wikipedia summary</a>.</li>
    <li id="ref3">Keller, M.C. et al. (2013). The Genetic Correlation Between Height and IQ: Shared Genes or Assortative Mating? <em>PLOS Genetics</em> 9(4). <a href="https://journals.plos.org/plosgenetics/article?id=10.1371/journal.pgen.1003451" target="_blank" rel="noopener">Full text</a>.</li>
    <li id="ref4">Gottfredson, L.S. (1997). Why <em>g</em> Matters: The Complexity of Everyday Life. <em>Intelligence</em> 24, 79–132. See also: <a href="https://en.wikipedia.org/wiki/Cognitive_epidemiology" target="_blank" rel="noopener">Wikipedia: Cognitive epidemiology</a>.</li>
    <li id="ref5">Kanazawa, S. (2011). Intelligence and physical attractiveness. <em>Intelligence</em> 39(1), 7–14. <a href="https://personal.lse.ac.uk/kanazawa/pdfs/i2011.pdf" target="_blank" rel="noopener">PDF</a>. <em>Note: the large UK effect (r = 0.38) is likely inflated by non-independent rating; the same teacher assessed both traits. Kanazawa is a highly controversial researcher; his broader body of work has been widely criticised for methodological and ethical reasons. See </em><a href="https://en.wikipedia.org/wiki/Satoshi_Kanazawa" target="_blank" rel="noopener">Wikipedia</a>.</li>
    <li id="ref6">Mitchem, D.G. et al. (2015). No Relationship Between Intelligence and Facial Attractiveness in a Large, Genetically Informative Sample. <em>Evolution and Human Behavior</em> 36(3), 240–247. <a href="https://pmc.ncbi.nlm.nih.gov/articles/PMC4415372/" target="_blank" rel="noopener">Full text (PMC)</a>.</li>
    <li id="ref7">Border, R. et al. (2022). Cross-trait assortative mating is widespread and inflates genetic correlation estimates. <em>Science</em> 378(6621). <a href="https://www.science.org/doi/10.1126/science.abo2059" target="_blank" rel="noopener">Full text</a>.</li>
    <li id="ref8">Assortative mating meta-analysis across 22 traits: <a href="https://www.biorxiv.org/content/10.1101/2022.03.19.484997v1.full" target="_blank" rel="noopener">Yengo et al. (2022), bioRxiv preprint</a>. Highest AM found for educational attainment, IQ, and political values.</li>
    <li id="ref14">Greenwood, J. et al. (2014). Marry Your Like: Assortative Mating and Income Inequality. <em>American Economic Review</em> 104(5). <a href="https://en.wikipedia.org/wiki/Assortative_mating" target="_blank" rel="noopener">Wikipedia: Assortative mating</a>. Finds that if 2005 mating patterns had prevailed in 1960, the Gini coefficient would have been substantially lower. AM has intensified dramatically over the intervening decades, driven by women entering the workforce and education becoming the primary sorting mechanism.</li>
    <li id="ref15">Chetty, R. et al. (2014). Where is the Land of Opportunity? The Geography of Intergenerational Mobility in the United States. <em>Quarterly Journal of Economics</em> 129(4). <a href="https://opportunityinsights.org" target="_blank" rel="noopener">Opportunity Insights</a>. The intergenerational wealth elasticity used to calibrate the wealth coefficient in the model (≈ 0.45) derives from this and related work.</li>
    <li id="ref17">Acemoglu, D. &amp; Restrepo, P. (2018). Artificial Intelligence, Automation and Work. <em>NBER Working Paper</em> 24196. <a href="https://www.nber.org/papers/w24196" target="_blank" rel="noopener">NBER</a>. Empirical analysis of automation's effect on employment and wages - finds that robots reduce both employment and wages of workers in affected commuting zones. AI extends this dynamic to knowledge work.</li>
    <li id="ref18">Autor, D. (2024). Applying AI: The Next Frontier in Labor Market Impacts. <a href="https://economics.mit.edu/sites/default/files/2024-04/Applying%20AI.pdf" target="_blank" rel="noopener">MIT Economics</a>. Surveys the emerging evidence on AI's occupational impacts, noting that unlike previous automation which hollowed out middle-skill routine work, AI disproportionately targets high-skill cognitive tasks - lawyers, radiologists, coders, analysts - while leaving physical and care-based work relatively untouched in the near term.</li>
    <li id="ref16">Piketty, T. (2014). <em>Capital in the Twenty-First Century</em>. Belknap/Harvard. The core argument - that the return on capital (r) systematically exceeds the growth rate of the economy (g) when conditions allow - is the macroeconomic context for why the legal inheritance channel does not self-correct: capital compounds faster than income grows, concentrating wealth upward absent intervention. See also: <a href="https://en.wikipedia.org/wiki/Capital_in_the_Twenty-First_Century" target="_blank" rel="noopener">Wikipedia summary</a>.</li>
    <li id="ref19">Fagereng, A., Mogstad, M. &amp; R&oslash;nning, M. (2021). <a href="https://www.nber.org/papers/w29903" target="_blank" rel="noopener">Marriage, Assortative Mating and Wealth Inequality.</a> NBER Working Paper 29903. Using Norwegian administrative data, finds pre-marriage wealth rank correlations of 0.45&#8211;0.50 between spouses, independently of education - suggesting wealth has always been a sorting signal, partially concealed by the credential that proxied for it.</li>
    <li id="ref20">Erola, J. &amp; Kilpi-Jakonen, E. (2021). <a href="https://journals.sagepub.com/doi/10.1177/00016993211004703" target="_blank" rel="noopener">The role of partnering and assortative mating for income inequality: The case of Finland, 1991&ndash;2014.</a> <em>Acta Sociologica</em> 64(3). Documents that changes in partnering patterns directly mediate income inequality growth even in a high-redistribution Nordic context, confirming the AM&#8594;inequality feedback loop is structural rather than institutional.</li>
    <li id="ref21">Cajner, T. et al. (2021). <a href="https://www.bls.gov/osmr/research-papers/2021/pdf/ec210020.pdf" target="_blank" rel="noopener">The K-Shaped Recovery.</a> US Bureau of Labor Statistics Research Paper. Documents the post-COVID bifurcation pattern in which upper-income households recovered and accelerated while lower-income households stagnated or fell - now considered a structural feature of AI-era labour markets rather than a cyclical anomaly.</li>
    <li id="ref22">International Federation of Robotics (2024). <a href="https://ifr.org/ifr-press-releases/news/global-robot-demand-in-factories-doubles-over-10-years" target="_blank" rel="noopener">World Robotics 2024: Global Robot Demand in Factories Doubles Over 10 Years.</a> IFR Press Release. Reports 542,000 new industrial robots installed globally in 2024, worldwide operational stock exceeding 4.66 million units, and robot density in manufacturing doubling from 74 to 162 units per 10,000 employees between 2016 and 2023.</li>
    <li id="ref23">Robotics and Automation News (2025). <a href="https://roboticsandautomationnews.com/2025/12/21/venture-capital-and-private-equity-in-robotics-where-is-the-smart-money-going/97794/" target="_blank" rel="noopener">Venture capital and private equity in robotics: Where is the smart money going?</a> Reports robotics startups raising over $6 billion in the first seven months of 2025, exceeding the total for all of 2024, with concentration in AI-powered physical automation backed by Nvidia, Amazon, Sequoia, and Andreessen Horowitz.</li>
  </ol>
</div>

<div class="viz-tooltip" id="tooltip"></div>

<script>
/* ============================================================
   SHARED MATH
   ============================================================ */

function normalPDF(x) {
  return Math.exp(-0.5 * x * x) / Math.sqrt(2 * Math.PI);
}

function erf(x) {
  // Abramowitz & Stegun 7.1.26, max error 1.5e-7
  const a = [0.254829592, -0.284496736, 1.421413741, -1.453152027, 1.061405429];
  const p = 0.3275911;
  const sign = x < 0 ? -1 : 1;
  x = Math.abs(x);
  const t = 1 / (1 + p * x);
  let y = 1 - (((((a[4]*t + a[3])*t + a[2])*t + a[1])*t + a[0])*t) * Math.exp(-x*x);
  return sign * y;
}

function normalCDF(x) {
  return 0.5 * (1 + erf(x / Math.SQRT2));
}

// P(all k standard normals > z) under compound symmetry equicorrelation model
// X_i = sqrt(rho)*Z + sqrt(1-rho)*eps_i, Z,eps_i ~ N(0,1)
function compoundProb(k, z, rho) {
  if (rho <= 0.001) return Math.pow(1 - normalCDF(z), k);
  const sqR = Math.sqrt(rho);
  const sqC = Math.sqrt(1 - rho);
  const N = 300, lo = -5.5, hi = 5.5, dx = (hi - lo) / N;
  let sum = 0;
  for (let i = 0; i < N; i++) {
    const z0 = lo + (i + 0.5) * dx;
    const thr = (z - sqR * z0) / sqC;
    const p = 1 - normalCDF(thr);
    sum += normalPDF(z0) * Math.pow(Math.max(0, p), k) * dx;
  }
  return Math.max(0, sum);
}

/* ============================================================
   VIZ 1 - BIVARIATE GAUSSIAN
   ============================================================ */

(function initV1() {
  const svg = document.getElementById('v1-svg');
  const W = 500, H = 420;

  // Layout
  const jx = 68, jy = 65, jw = 295, jh = 295;  // joint region
  const mxH = 55;   // x-marginal height above joint
  const myW = 55;   // y-marginal width right of joint
  const CX = jx + jw / 2;     // 68+147.5 = 215.5
  const CY = jy + jh / 2;     // 65+147.5 = 212.5
  const SC = jw / 9;           // 295/9 ≈ 32.78 px/σ - wider range prevents corner clipping

  function dx(x) { return jx + (x + 4.5) / 9 * jw; }
  function dy(y) { return jy + jh - (y + 4.5) / 9 * jh; }

  function makePath(pts) {
    return pts.map((p, i) => (i === 0 ? `M${p[0]},${p[1]}` : `L${p[0]},${p[1]}`)).join(' ');
  }

  // Build static SVG structure
  let html = `<defs>
    <clipPath id="v1-clip">
      <rect x="${jx}" y="${jy}" width="${jw}" height="${jh}"/>
    </clipPath>
  </defs>`;

  // Joint background
  html += `<rect x="${jx}" y="${jy}" width="${jw}" height="${jh}" fill="#faf8f5" stroke="#ddd6cc" stroke-width="0.5"/>`;

  // Grid lines
  for (let v = -3; v <= 3; v++) {
    const x = dx(v), y = dy(v);
    const col = v === 0 ? '#ccc4b8' : '#e8e0d4';
    const w = v === 0 ? 0.8 : 0.4;
    html += `<line x1="${x}" y1="${jy}" x2="${x}" y2="${jy+jh}" stroke="${col}" stroke-width="${w}"/>`;
    html += `<line x1="${jx}" y1="${y}" x2="${jx+jw}" y2="${y}" stroke="${col}" stroke-width="${w}"/>`;
  }

  // Contour ellipses (filled first, back to front: c=3,2,1)
  for (let c = 3; c >= 1; c--) {
    const fills  = ['rgba(139,58,30,0.22)','rgba(139,58,30,0.11)','rgba(139,58,30,0.05)'];
    const strOps = ['0.75','0.45','0.20'];
    html += `<ellipse id="v1e${c}" cx="${CX}" cy="${CY}"
      fill="${fills[c-1]}" stroke="#8b3a1e" stroke-width="1.2" stroke-opacity="${strOps[c-1]}"
      clip-path="url(#v1-clip)"/>`;
  }

  // Marginal: X₁ (above joint)
  {
    const maxP = normalPDF(0);
    const pscale = (mxH - 8) / maxP;
    const baseY = jy;
    let pts = [];
    const N = 120;
    for (let i = 0; i <= N; i++) {
      const dataX = -4.5 + 9 * i / N;
      const svgX = dx(dataX);
      const svgY = baseY - normalPDF(dataX) * pscale;
      pts.push([svgX, svgY]);
    }
    const p = makePath(pts);
    const fill = `M${dx(-3.5)},${jy} ${p.slice(1)} L${dx(3.5)},${jy} Z`;
    html += `<path d="${fill}" fill="rgba(139,58,30,0.08)" stroke="none"/>`;
    html += `<path d="${p}" fill="none" stroke="#8b3a1e" stroke-width="1.5" stroke-opacity="0.7"/>`;
    html += `<text x="${CX}" y="${jy - mxH + 4}" text-anchor="middle" font-family="Spectral,serif" font-style="italic" font-size="10" fill="#8b3a1e" opacity="0.8">N(0,1) - always</text>`;
  }

  // Marginal: X₂ (right of joint)
  {
    const maxP = normalPDF(0);
    const pscale = (myW - 8) / maxP;
    const baseX = jx + jw;
    let pts = [];
    const N = 120;
    for (let i = 0; i <= N; i++) {
      const dataY = -4.5 + 9 * i / N;
      const svgY = dy(dataY);
      const svgX = baseX + normalPDF(dataY) * pscale;
      pts.push([svgX, svgY]);
    }
    const p = makePath(pts);
    const fill = `M${baseX},${dy(-3.5)} L${pts[0][0]},${pts[0][1]} ${p.slice(p.indexOf('L'))} L${baseX},${dy(3.5)} Z`;
    html += `<path d="${fill}" fill="rgba(139,58,30,0.08)" stroke="none"/>`;
    html += `<path d="${p}" fill="none" stroke="#8b3a1e" stroke-width="1.5" stroke-opacity="0.7"/>`;
    // Rotated label
    const lx = jx + jw + myW - 2, ly = CY;
    html += `<text x="${lx}" y="${ly}" text-anchor="middle" font-family="Spectral,serif" font-style="italic" font-size="10" fill="#8b3a1e" opacity="0.8" transform="rotate(90,${lx},${ly})">N(0,1) - always</text>`;
  }

  // Axes
  html += `<line x1="${jx}" y1="${jy+jh}" x2="${jx+jw}" y2="${jy+jh}" stroke="#7a6e5e" stroke-width="1"/>`;
  html += `<line x1="${jx}" y1="${jy}" x2="${jx}" y2="${jy+jh}" stroke="#7a6e5e" stroke-width="1"/>`;

  // Ticks & tick labels
  for (let v = -3; v <= 3; v++) {
    const x = dx(v), y = dy(v);
    html += `<line x1="${x}" y1="${jy+jh}" x2="${x}" y2="${jy+jh+5}" stroke="#7a6e5e" stroke-width="0.8"/>`;
    html += `<line x1="${jx-5}" y1="${y}" x2="${jx}" y2="${y}" stroke="#7a6e5e" stroke-width="0.8"/>`;
    if (v !== 0) {
      html += `<text x="${x}" y="${jy+jh+15}" text-anchor="middle" font-family="Spectral,serif" font-size="10" fill="#7a6e5e">${v}σ</text>`;
      html += `<text x="${jx-8}" y="${y+4}" text-anchor="end" font-family="Spectral,serif" font-size="10" fill="#7a6e5e">${v}σ</text>`;
    }
  }

  // Axis labels
  html += `<text x="${CX}" y="${H-4}" text-anchor="middle" font-family="Cormorant Garamond,serif" font-style="italic" font-size="14" fill="#3d3628">X₁</text>`;
  html += `<text x="14" y="${CY+4}" text-anchor="middle" font-family="Cormorant Garamond,serif" font-style="italic" font-size="14" fill="#3d3628" transform="rotate(-90,14,${CY})">X₂</text>`;

  // Probability labels for contours
  const pLabels = [['39%', 1], ['87%', 2], ['99%', 3]];
  pLabels.forEach(([lbl, c]) => {
    html += `<text id="v1pl${c}" x="0" y="0" font-family="Spectral,serif" font-style="italic" font-size="9" fill="#8b3a1e" opacity="0.7" text-anchor="middle">${lbl}</text>`;
  });

  // Sigma annotation - proper 2×2 matrix layout
  html += `<rect x="${jx+5}" y="${jy+5}" width="138" height="52" fill="rgba(255,255,255,0.88)" rx="2"/>`;
  html += `<text x="${jx+10}" y="${jy+23}" font-family="Spectral,serif" font-style="italic" font-size="10.5" fill="#8b3a1e" opacity="0.9">\u03A3 =</text>`;
  // Left bracket
  html += `<line x1="${jx+44}" y1="${jy+10}" x2="${jx+44}" y2="${jy+50}" stroke="#8b3a1e" stroke-width="1.5" stroke-opacity="0.65"/>`;
  html += `<line x1="${jx+44}" y1="${jy+10}" x2="${jx+49}" y2="${jy+10}" stroke="#8b3a1e" stroke-width="1.5" stroke-opacity="0.65"/>`;
  html += `<line x1="${jx+44}" y1="${jy+50}" x2="${jx+49}" y2="${jy+50}" stroke="#8b3a1e" stroke-width="1.5" stroke-opacity="0.65"/>`;
  // Right bracket
  html += `<line x1="${jx+136}" y1="${jy+10}" x2="${jx+136}" y2="${jy+50}" stroke="#8b3a1e" stroke-width="1.5" stroke-opacity="0.65"/>`;
  html += `<line x1="${jx+131}" y1="${jy+10}" x2="${jx+136}" y2="${jy+10}" stroke="#8b3a1e" stroke-width="1.5" stroke-opacity="0.65"/>`;
  html += `<line x1="${jx+131}" y1="${jy+50}" x2="${jx+136}" y2="${jy+50}" stroke="#8b3a1e" stroke-width="1.5" stroke-opacity="0.65"/>`;
  // Row 1: [ 1,  ρ ]
  html += `<text x="${jx+72}" y="${jy+25}" text-anchor="middle" font-family="Spectral,serif" font-style="italic" font-size="10.5" fill="#8b3a1e" opacity="0.9">1</text>`;
  html += `<text id="v1-ann-r1c2" x="${jx+113}" y="${jy+25}" text-anchor="middle" font-family="Spectral,serif" font-style="italic" font-size="10.5" fill="#8b3a1e" opacity="0.9">0.00</text>`;
  // Row 2: [ ρ,  1 ]
  html += `<text id="v1-ann-r2c1" x="${jx+72}" y="${jy+43}" text-anchor="middle" font-family="Spectral,serif" font-style="italic" font-size="10.5" fill="#8b3a1e" opacity="0.9">0.00</text>`;
  html += `<text x="${jx+113}" y="${jy+43}" text-anchor="middle" font-family="Spectral,serif" font-style="italic" font-size="10.5" fill="#8b3a1e" opacity="0.9">1</text>`;

  svg.innerHTML = html;

  function update(rho) {
    for (let c = 1; c <= 3; c++) {
      const rx = c * Math.sqrt(Math.max(1e-4, 1 + rho)) * SC;
      const ry = c * Math.sqrt(Math.max(1e-4, 1 - rho)) * SC;
      const el = document.getElementById(`v1e${c}`);
      el.setAttribute('rx', rx.toFixed(2));
      el.setAttribute('ry', ry.toFixed(2));
      el.setAttribute('transform', `rotate(-45,${CX.toFixed(1)},${CY.toFixed(1)})`);
      // Update probability label positions
      const lx = CX + rx * Math.cos(-Math.PI/4) + 0;
      const ly = CY + rx * Math.sin(-Math.PI/4) - 4;
      const pl = document.getElementById(`v1pl${c}`);
      if (pl) { pl.setAttribute('x', lx.toFixed(1)); pl.setAttribute('y', ly.toFixed(1)); }
    }
    const s = rho >= 0 ? '+' : '';
    document.getElementById('v1-ann-r1c2').textContent = s + rho.toFixed(2);
    document.getElementById('v1-ann-r2c1').textContent = s + rho.toFixed(2);
    document.getElementById('v1-rho-display').textContent = (rho >= 0 ? '+' : '') + rho.toFixed(2);
  }

  const slider = document.getElementById('v1-rho');
  slider.addEventListener('input', () => update(slider.value / 100));
  update(0);
})();


/* ============================================================
   VIZ 2 - PROBABILITY CASCADE
   ============================================================ */

(function initV2() {
  const svg = document.getElementById('v2-svg');
  const W = 560, H = 300;
  const px = 70, py = 20, pw = 450, ph = 230;  // plot area

  const COLS = { indep: '#b0a898', corr: '#8b3a1e' };
  const ks = [1, 2, 3, 4, 5, 6];

  // Log scale: P from ~0.5 down to ~1e-11
  const yMin = -11, yMax = 0;
  function pyMap(logP) {
    return py + ph - (logP - yMin) / (yMax - yMin) * ph;
  }
  function pxMap(k) {
    return px + (k - 1) / (ks.length - 1) * pw;
  }

  let baseHTML = '';

  // Plot background
  baseHTML += `<rect x="${px}" y="${py}" width="${pw}" height="${ph}" fill="#faf8f5" stroke="#ddd6cc" stroke-width="0.5"/>`;

  // Horizontal grid lines
  for (let e = 0; e >= yMin; e--) {
    const y = pyMap(e);
    const col = e === 0 ? '#c0b8ac' : '#e8e0d4';
    baseHTML += `<line x1="${px}" y1="${y}" x2="${px+pw}" y2="${y}" stroke="${col}" stroke-width="${e===0?0.8:0.4}"/>`;
    const label = e === 0 ? '1' : e === -1 ? '10⁻¹' : e === -2 ? '10⁻²' : e === -5 ? '10⁻⁵' : e === -10 ? '10⁻¹⁰' : '';
    if (label) baseHTML += `<text x="${px-6}" y="${y+4}" text-anchor="end" font-family="Spectral,serif" font-size="9" fill="#7a6e5e">${label}</text>`;
  }

  // x-axis
  ks.forEach(k => {
    const x = pxMap(k);
    baseHTML += `<line x1="${x}" y1="${py+ph}" x2="${x}" y2="${py+ph+5}" stroke="#7a6e5e" stroke-width="0.8"/>`;
    baseHTML += `<text x="${x}" y="${py+ph+16}" text-anchor="middle" font-family="Spectral,serif" font-size="11" fill="#3d3628">${k}</text>`;
  });

  // Axis labels
  baseHTML += `<text x="${px+pw/2}" y="${H-2}" text-anchor="middle" font-family="Cormorant Garamond,serif" font-style="italic" font-size="13" fill="#3d3628">Number of traits k</text>`;
  baseHTML += `<text x="12" y="${py+ph/2}" text-anchor="middle" font-family="Cormorant Garamond,serif" font-style="italic" font-size="13" fill="#3d3628" transform="rotate(-90,12,${py+ph/2})">Probability</text>`;

  // Legend
  baseHTML += `<line x1="${px+pw-160}" y1="${py+14}" x2="${px+pw-135}" y2="${py+14}" stroke="${COLS.indep}" stroke-width="2" stroke-dasharray="4,2"/>`;
  baseHTML += `<circle cx="${px+pw-148}" cy="${py+14}" r="4" fill="${COLS.indep}"/>`;
  baseHTML += `<text x="${px+pw-128}" y="${py+18}" font-family="Spectral,serif" font-size="10" fill="#6b5f4e">Independent (ρ=0)</text>`;
  baseHTML += `<line x1="${px+pw-160}" y1="${py+32}" x2="${px+pw-135}" y2="${py+32}" stroke="${COLS.corr}" stroke-width="2"/>`;
  baseHTML += `<circle cx="${px+pw-148}" cy="${py+32}" r="4" fill="${COLS.corr}"/>`;
  baseHTML += `<text x="${px+pw-128}" y="${py+36}" font-family="Spectral,serif" font-size="10" fill="#6b5f4e">Correlated</text>`;

  // Dynamic paths & dots
  baseHTML += `<path id="v2-path-i" fill="none" stroke="${COLS.indep}" stroke-width="1.5" stroke-dasharray="5,3"/>`;
  baseHTML += `<path id="v2-path-c" fill="none" stroke="${COLS.corr}" stroke-width="1.8"/>`;
  ks.forEach(k => {
    baseHTML += `<circle id="v2ci${k}" r="4.5" fill="${COLS.indep}" stroke="white" stroke-width="1.2"/>`;
    baseHTML += `<circle id="v2cc${k}" r="4.5" fill="${COLS.corr}" stroke="white" stroke-width="1.2"/>`;
    baseHTML += `<text id="v2ti${k}" font-family="Spectral,serif" font-size="8.5" fill="${COLS.indep}" text-anchor="middle"></text>`;
    baseHTML += `<text id="v2tc${k}" font-family="Spectral,serif" font-size="8.5" fill="${COLS.corr}" text-anchor="middle"></text>`;
  });

  svg.innerHTML = baseHTML;

  function fmt(p) {
    if (p >= 0.01) return (p * 100).toFixed(1) + '%';
    const e = Math.floor(Math.log10(p));
    const m = (p / Math.pow(10, e)).toFixed(1);
    return `${m}×10^${e}`;
  }

  function update() {
    const z   = parseFloat(document.getElementById('v2-z').value) / 10;
    const rho = parseFloat(document.getElementById('v2-rho').value) / 100;
    document.getElementById('v2-z-display').textContent = z.toFixed(1);
    document.getElementById('v2-rho-display').textContent = rho.toFixed(2);

    const ptsI = [], ptsC = [];
    ks.forEach(k => {
      const pi = Math.pow(1 - normalCDF(z), k);
      const pc = compoundProb(k, z, rho);
      const liP  = Math.log10(Math.max(pi, 1e-12));
      const lcP  = Math.log10(Math.max(pc, 1e-12));
      const x = pxMap(k);
      const yI = Math.min(py + ph, Math.max(py, pyMap(liP)));
      const yC = Math.min(py + ph, Math.max(py, pyMap(lcP)));
      ptsI.push([x, yI]);
      ptsC.push([x, yC]);
      document.getElementById(`v2ci${k}`).setAttribute('cx', x);
      document.getElementById(`v2ci${k}`).setAttribute('cy', yI);
      document.getElementById(`v2cc${k}`).setAttribute('cx', x);
      document.getElementById(`v2cc${k}`).setAttribute('cy', yC);
      const ti = document.getElementById(`v2ti${k}`);
      ti.setAttribute('x', x); ti.setAttribute('y', yI - 8);
      ti.textContent = k <= 4 ? fmt(pi) : '';
      const tc = document.getElementById(`v2tc${k}`);
      tc.setAttribute('x', x); tc.setAttribute('y', yC - 8);
      tc.textContent = k <= 4 ? fmt(pc) : '';
    });
    document.getElementById('v2-path-i').setAttribute('d', ptsI.map((p,i)=>(i?'L':'M')+p[0].toFixed(1)+','+p[1].toFixed(1)).join(' '));
    document.getElementById('v2-path-c').setAttribute('d', ptsC.map((p,i)=>(i?'L':'M')+p[0].toFixed(1)+','+p[1].toFixed(1)).join(' '));
  }

  document.getElementById('v2-z').addEventListener('input', update);
  document.getElementById('v2-rho').addEventListener('input', update);
  update();
})();


/* ============================================================
   VIZ 3 - TRAIT CORRELATION HEATMAP
   ============================================================ */

(function initV3() {
  const svg = document.getElementById('v3-svg');
  const traits = ['Intelligence', 'Attractiveness', 'Height', 'Wealth', 'Conscientiousness', 'Health'];
  const N = traits.length;

  // Empirical correlation estimates (approximate, from literature)
  const R = [
    // IQ    Attr  Hght  Wlth  Cons  Hlth
    [ 1.00,  0.18, 0.22, 0.38, 0.25, 0.32],  // Intelligence
    [ 0.18,  1.00, 0.22, 0.15, 0.08, 0.19],  // Attractiveness
    [ 0.22,  0.22, 1.00, 0.16, 0.10, 0.22],  // Height
    [ 0.38,  0.15, 0.16, 1.00, 0.22, 0.20],  // Wealth
    [ 0.25,  0.08, 0.10, 0.22, 1.00, 0.16],  // Conscientiousness
    [ 0.32,  0.19, 0.22, 0.20, 0.16, 1.00],  // Health
  ];

  const sources = [
    ['Self', 'Contested (r=0.10–0.38; Kanazawa 2011, disputed by Mitchem 2015)', 'Meta-analysis r≈0.22 (Teasdale & Owen)', 'Cawley & Heckman r≈0.35–0.40', 'Chamorro-Premuzic r≈0.25', 'Gottfredson & Deary; Whalley & Deary r≈0.30'],
    ['Contested (r=0.10–0.38)', 'Self', 'r≈0.20–0.25 (Stulp et al. 2015)', 'Hamermesh & Biddle "beauty premium" r≈0.15', 'Limited evidence r≈0.08', 'Facial symmetry & health r≈0.20'],
    ['Meta-analysis r≈0.22', 'r≈0.20–0.25', 'Self', 'r≈0.15–0.18 (Stulp)', 'Little evidence r≈0.10', 'Growth factors r≈0.22'],
    ['r≈0.35–0.40', 'Beauty premium r≈0.15', 'r≈0.15', 'Self', 'Nyhus & Pons r≈0.22', 'SES–health r≈0.20'],
    ['r≈0.25', 'r≈0.08 (weak)', 'r≈0.10', 'r≈0.22', 'Self', 'r≈0.16 (Bogg & Roberts)'],
    ['Whalley–Deary r≈0.30', 'Facial symmetry r≈0.19', 'r≈0.22', 'SES–health r≈0.20', 'r≈0.16', 'Self'],
  ];

  const cx0 = 112, cy0 = 110, cellW = 57, cellH = 57;

  function rToColor(r) {
    // white (255,255,255) → accent (139,58,30) for r=0..1
    const t = Math.min(1, Math.max(0, r));
    return `rgb(${Math.round(255+(139-255)*t)},${Math.round(255+(58-255)*t)},${Math.round(255+(30-255)*t)})`;
  }

  let html = '';

  // Column headers (rotated)
  traits.forEach((t, j) => {
    const x = cx0 + j * cellW + cellW / 2;
    const y = cy0 - 8;
    html += `<text x="${x}" y="${y}" text-anchor="start" font-family="Spectral,serif" font-size="10.5" fill="#3d3628"
      transform="rotate(-40,${x},${y})">${t}</text>`;
  });

  // Row headers
  traits.forEach((t, i) => {
    const y = cy0 + i * cellH + cellH / 2 + 4;
    html += `<text x="${cx0-8}" y="${y}" text-anchor="end" font-family="Spectral,serif" font-size="10.5" fill="#3d3628">${t}</text>`;
  });

  // Cells
  traits.forEach((_, i) => {
    traits.forEach((_, j) => {
      const x = cx0 + j * cellW;
      const y = cy0 + i * cellH;
      const r = R[i][j];
      const fill = rToColor(r);
      const textFill = r > 0.6 ? 'rgba(255,255,255,0.95)' : '#3d3628';
      const isDiag = i === j;
      const si = Math.min(i, j), sj = Math.max(i, j);
      html += `<rect class="v3cell" x="${x+1}" y="${y+1}" width="${cellW-2}" height="${cellH-2}"
        fill="${fill}" rx="2" data-r="${r}" data-src="${encodeURIComponent(sources[si][sj])}"
        style="cursor:${isDiag?'default':'pointer'}"/>`;
      if (isDiag) {
        // Diagonal: hatched overlay
        html += `<line x1="${x+1}" y1="${y+1}" x2="${x+cellW-1}" y2="${y+cellH-1}" stroke="rgba(255,255,255,0.5)" stroke-width="1"/>`;
      }
      html += `<text x="${x+cellW/2}" y="${y+cellH/2+4}" text-anchor="middle"
        font-family="Spectral,serif" font-size="10" fill="${textFill}" pointer-events="none">
        ${isDiag ? '-' : r.toFixed(2)}</text>`;
    });
  });

  // Color scale legend - placed with enough room below the matrix
  const lx = cx0, ly = cy0 + N * cellH + 30;
  const lw = N * cellW, lh = 13;
  const gid = 'v3grad';
  html += `<defs><linearGradient id="${gid}" x1="0%" y1="0%" x2="100%" y2="0%">
    <stop offset="0%" stop-color="${rToColor(0)}"/>
    <stop offset="100%" stop-color="${rToColor(1)}"/>
  </linearGradient></defs>`;
  // Label above bar
  html += `<text x="${lx+lw/2}" y="${ly-5}" text-anchor="middle" font-family="Spectral,serif" font-size="9.5" fill="#7a6e5e">Correlation coefficient r</text>`;
  html += `<rect x="${lx}" y="${ly}" width="${lw}" height="${lh}" fill="url(#${gid})" stroke="#ccc" stroke-width="0.5" rx="2"/>`;
  // End labels below bar
  html += `<text x="${lx}" y="${ly+lh+13}" font-family="Spectral,serif" font-size="9" fill="#7a6e5e">0.0</text>`;
  html += `<text x="${lx+lw/4}" y="${ly+lh+13}" text-anchor="middle" font-family="Spectral,serif" font-size="9" fill="#7a6e5e">0.25</text>`;
  html += `<text x="${lx+lw/2}" y="${ly+lh+13}" text-anchor="middle" font-family="Spectral,serif" font-size="9" fill="#7a6e5e">0.50</text>`;
  html += `<text x="${lx+lw*3/4}" y="${ly+lh+13}" text-anchor="middle" font-family="Spectral,serif" font-size="9" fill="#7a6e5e">0.75</text>`;
  html += `<text x="${lx+lw}" y="${ly+lh+13}" text-anchor="end" font-family="Spectral,serif" font-size="9" fill="#7a6e5e">1.0</text>`;
  // Tick marks on bar
  [0, 0.25, 0.5, 0.75, 1].forEach(t => {
    const tx = lx + t * lw;
    html += `<line x1="${tx}" y1="${ly+lh}" x2="${tx}" y2="${ly+lh+5}" stroke="#aaa" stroke-width="0.8"/>`;
  });

  // Title
  html += `<text x="${cx0 + N*cellW/2}" y="18" text-anchor="middle" font-family="Cormorant Garamond,serif" font-size="13.5" fill="#1a1610">Empirical Trait Correlation Matrix Σ̂</text>`;
  html += `<text x="${cx0 + N*cellW/2}" y="34" text-anchor="middle" font-family="Spectral,serif" font-style="italic" font-size="10" fill="#7a6e5e">(Approximate estimates from population-based studies - hover for sources)</text>`;

  svg.innerHTML = html;

  // Tooltip
  const tooltip = document.getElementById('tooltip');
  svg.querySelectorAll('.v3cell').forEach(cell => {
    cell.addEventListener('mousemove', e => {
      const r = cell.getAttribute('data-r');
      const src = decodeURIComponent(cell.getAttribute('data-src'));
      tooltip.innerHTML = `<strong>r ≈ ${parseFloat(r).toFixed(2)}</strong><br>${src}`;
      tooltip.style.opacity = 1;
      tooltip.style.left = (e.clientX + 14) + 'px';
      tooltip.style.top  = (e.clientY - 10) + 'px';
    });
    cell.addEventListener('mouseleave', () => { tooltip.style.opacity = 0; });
  });
})();


/* ============================================================
   VIZ 4 - CONDITIONAL DISTRIBUTION
   ============================================================ */

(function initV4() {
  const canvas = document.getElementById('v4-canvas');
  const overlayEl = document.getElementById('v4-overlay');
  const condSvg = document.getElementById('v4-cond-svg');

  // Canvas actual pixel size - square
  const CW = 420, CH = 420;
  canvas.style.width  = '100%';
  canvas.style.height = 'auto';

  const ctx = canvas.getContext('2d');

  // Data ranges
  const xMin = -3.5, xMax = 3.5, yMin = -3.5, yMax = 3.5;
  // Square joint region 330×330: left=50 top=20 right=380 bottom=350
  const jleft = 50, jtop = 20, jright = 380, jbottom = 350;
  const jw = jright - jleft, jh = jbottom - jtop;

  function canvasX(dataX) { return jleft + (dataX - xMin) / (xMax - xMin) * jw; }
  function canvasY(dataY) { return jtop + (1 - (dataY - yMin) / (yMax - yMin)) * jh; }
  function invCanvasX(px) { return xMin + (px - jleft) / jw * (xMax - xMin); }

  let x0 = 1.2;  // conditioning value
  let rho = 0.3;

  function drawDensity(rho) {
    const imgData = ctx.createImageData(CW, CH);
    const data = imgData.data;

    // Find max PDF for normalization
    const maxPDF = 1 / (2 * Math.PI * Math.sqrt(1 - rho * rho));

    for (let py = 0; py < CH; py++) {
      for (let px = 0; px < CW; px++) {
        const idx = (py * CW + px) * 4;
        // Only render joint region
        if (px < jleft || px > jright || py < jtop || py > jbottom) {
          data[idx]=248; data[idx+1]=244; data[idx+2]=236; data[idx+3]=255;
          continue;
        }
        const x = xMin + (px - jleft) / jw * (xMax - xMin);
        const y = yMax - (py - jtop) / jh * (yMax - yMin);
        const q = (x*x - 2*rho*x*y + y*y) / (2*(1-rho*rho));
        const pdf = Math.exp(-q) / (2*Math.PI*Math.sqrt(1-rho*rho));
        const t = Math.pow(pdf / maxPDF, 0.5); // gamma for contrast
        data[idx]   = Math.round(255 + (139-255)*t);
        data[idx+1] = Math.round(255 + (58-255)*t);
        data[idx+2] = Math.round(255 + (30-255)*t);
        data[idx+3] = 255;
      }
    }
    ctx.putImageData(imgData, 0, 0);

    // Axes
    ctx.strokeStyle = '#7a6e5e';
    ctx.lineWidth = 1;
    ctx.beginPath();
    ctx.moveTo(jleft, jtop); ctx.lineTo(jleft, jbottom);
    ctx.moveTo(jleft, jbottom); ctx.lineTo(jright, jbottom);
    ctx.stroke();

    // Tick marks
    ctx.fillStyle = '#7a6e5e';
    ctx.font = '16px Spectral, serif';
    ctx.textAlign = 'center';
    for (let v = -3; v <= 3; v++) {
      const cx = canvasX(v), cy = canvasY(v);
      ctx.strokeStyle = '#7a6e5e'; ctx.lineWidth = 0.8;
      ctx.beginPath(); ctx.moveTo(cx, jbottom); ctx.lineTo(cx, jbottom+6); ctx.stroke();
      ctx.beginPath(); ctx.moveTo(jleft-6, cy); ctx.lineTo(jleft, cy); ctx.stroke();
      if (v !== 0) {
        ctx.fillText(v+'σ', cx, jbottom+18);
        ctx.textAlign = 'right';
        ctx.fillText(v+'σ', jleft-8, cy+5);
        ctx.textAlign = 'center';
      }
    }
    // Axis labels
    ctx.font = 'italic 18px Cormorant Garamond, serif';
    ctx.fillStyle = '#3d3628';
    ctx.fillText('X₁', jleft + jw/2, jbottom + 28);
    ctx.save();
    ctx.translate(16, jtop + jh/2);
    ctx.rotate(-Math.PI/2);
    ctx.fillText('X₂', 0, 0);
    ctx.restore();
  }

  function drawCondLine() {
    const cx = canvasX(x0);
    ctx.save();
    ctx.strokeStyle = '#2d6e8a';
    ctx.lineWidth = 2;
    ctx.setLineDash([6, 3]);
    ctx.beginPath();
    ctx.moveTo(cx, jtop); ctx.lineTo(cx, jbottom);
    ctx.stroke();
    ctx.setLineDash([]);
    // x₀ label
    ctx.fillStyle = '#2d6e8a';
    ctx.font = 'italic 14px Spectral, serif';
    ctx.textAlign = 'center';
    ctx.fillText(`x₀ = ${x0.toFixed(1)}`, cx, jtop - 6);
    ctx.restore();
  }

  function drawCondSvg(rho, x0) {
    const condMean = rho * x0;
    const condSD = Math.sqrt(Math.max(1e-6, 1 - rho * rho));

    const W = 280, H = 280;
    const plotLeft = 42, plotRight = W - 16;
    const plotTop = 25, plotBottom = H - 40;
    const plotW = plotRight - plotLeft, plotH = plotBottom - plotTop;

    // Y-axis range same as canvas
    function svgY(dataY) { return plotTop + (1 - (dataY - yMin) / (yMax - yMin)) * plotH; }
    // X-axis: pdf value, 0 on left, max on right
    const maxPDF = normalPDF(0) / condSD;
    function svgX(pdf) { return plotLeft + (pdf / maxPDF) * plotW * 0.88; }

    let html = `<rect width="${W}" height="${H}" fill="white"/>`;
    html += `<rect x="${plotLeft}" y="${plotTop}" width="${plotW}" height="${plotH}" fill="#f0f4f8" stroke="#c8d4dc" stroke-width="0.5"/>`;

    // Grid
    for (let v = -3; v <= 3; v++) {
      const y = svgY(v);
      html += `<line x1="${plotLeft}" y1="${y}" x2="${plotRight}" y2="${y}" stroke="${v===0?'#b8c4cc':'#d8e4ea'}" stroke-width="${v===0?0.8:0.4}"/>`;
      html += `<line x1="${plotLeft-4}" y1="${y}" x2="${plotLeft}" y2="${y}" stroke="#7a6e5e" stroke-width="0.8"/>`;
    }

    // Build conditional density curve
    const N = 150;
    let pts = [];
    for (let i = 0; i <= N; i++) {
      const dataY = yMin + (yMax - yMin) * i / N;
      const z = (dataY - condMean) / condSD;
      const pdf = normalPDF(z) / condSD;
      pts.push([svgX(pdf), svgY(dataY)]);
    }
    const pathD = pts.map((p,i)=>(i===0?'M':'L')+p[0].toFixed(1)+','+p[1].toFixed(1)).join(' ');
    const fillD = `M${plotLeft},${svgY(yMin)} ${pathD.slice(1)} L${plotLeft},${svgY(yMax)} Z`;

    html += `<path d="${fillD}" fill="rgba(45,110,138,0.15)"/>`;
    html += `<path d="${pathD}" fill="none" stroke="#2d6e8a" stroke-width="2"/>`;

    // Mean line
    const meanY = svgY(condMean);
    html += `<line x1="${plotLeft}" y1="${meanY}" x2="${plotRight}" y2="${meanY}" stroke="#2d6e8a" stroke-width="1" stroke-dasharray="3,2" opacity="0.7"/>`;

    // Axis
    html += `<line x1="${plotLeft}" y1="${plotTop}" x2="${plotLeft}" y2="${plotBottom}" stroke="#7a6e5e" stroke-width="1"/>`;
    html += `<line x1="${plotLeft}" y1="${plotBottom}" x2="${plotRight}" y2="${plotBottom}" stroke="#7a6e5e" stroke-width="0.5"/>`;

    // Annotations
    html += `<text x="${plotLeft + plotW/2}" y="${plotTop-6}" text-anchor="middle" font-family="Spectral,serif" font-style="italic" font-size="9" fill="#2d6e8a">X₂ | X₁ = x₀</text>`;
    html += `<text x="${plotLeft+2}" y="${meanY-4}" font-family="Spectral,serif" font-style="italic" font-size="8" fill="#2d6e8a">μ=${condMean.toFixed(2)}</text>`;
    html += `<text x="${plotLeft + plotW/2}" y="${plotBottom+12}" text-anchor="middle" font-family="Spectral,serif" font-size="8" fill="#7a6e5e">f(x₂|x₁=x₀)</text>`;
    // Sigma annotation
    html += `<text x="${plotLeft + plotW/2}" y="${H-4}" text-anchor="middle" font-family="Spectral,serif" font-style="italic" font-size="8.5" fill="#2d6e8a">σ = √(1−ρ²) = ${condSD.toFixed(2)}</text>`;

    condSvg.innerHTML = html;
  }

  function redraw() {
    drawDensity(rho);
    drawCondLine();
    drawCondSvg(rho, x0);
    // Update formula
    const condMean = rho * x0;
    const condVar = 1 - rho * rho;
    document.getElementById('v4-formula').textContent =
      `X₂ | X₁ = ${x0.toFixed(1)}  ~  𝒩(${condMean.toFixed(2)}, ${condVar.toFixed(2)})`;
  }

  // Interaction: drag the vertical line
  let dragging = false;

  function getX0FromEvent(e) {
    const rect = canvas.getBoundingClientRect();
    const scaleX = CW / rect.width;
    const px = (e.clientX - rect.left) * scaleX;
    return Math.max(xMin + 0.1, Math.min(xMax - 0.1, invCanvasX(px)));
  }

  canvas.addEventListener('mousedown', e => {
    dragging = true;
    x0 = getX0FromEvent(e);
    redraw();
  });
  canvas.addEventListener('mousemove', e => {
    if (!dragging) return;
    x0 = getX0FromEvent(e);
    redraw();
  });
  canvas.addEventListener('mouseup', () => { dragging = false; });
  canvas.addEventListener('mouseleave', () => { dragging = false; });

  // Touch support
  canvas.addEventListener('touchstart', e => {
    e.preventDefault();
    dragging = true;
    x0 = getX0FromEvent(e.touches[0]);
    redraw();
  }, {passive: false});
  canvas.addEventListener('touchmove', e => {
    e.preventDefault();
    if (!dragging) return;
    x0 = getX0FromEvent(e.touches[0]);
    redraw();
  }, {passive: false});
  canvas.addEventListener('touchend', () => { dragging = false; });

  // Rho slider
  const rhoSlider = document.getElementById('v4-rho');
  rhoSlider.addEventListener('input', () => {
    rho = parseFloat(rhoSlider.value) / 100;
    document.getElementById('v4-rho-display').textContent = (rho >= 0 ? '+' : '') + rho.toFixed(2);
    redraw();
  });

  redraw();
  document.getElementById('v4-rho-display').textContent = '+0.30';
})();


/* ============================================================
   VIZ 5 - US WEALTH DISTRIBUTION (SVG) - linear + log toggle
   ============================================================ */
(function initV5() {
  var svg = document.getElementById('v5-svg');
  if (!svg) return;
  var W = 560, H = 320;
  var pl = 72, pr = 20, pt = 24, pb = 58;
  var pw = W - pl - pr, ph = H - pt - pb;

  var WT = [
    [0.00,1.0],[0.11,2.0],[0.20,3.70],[0.30,4.45],[0.40,4.92],
    [0.50,5.29],[0.60,5.53],[0.70,5.77],[0.80,6.00],
    [0.90,6.40],[0.95,6.71],[0.99,7.04],[1.00,7.70]
  ];
  var xMin=1.5, xMax=7.8;

  // ── shared helpers ──────────────────────────────────────────
  function sX(lw){ return pl+(lw-xMin)/(xMax-xMin)*pw; }
  function iX(sx){ return xMin+(sx-pl)/pw*(xMax-xMin); }
  function pct5(lw){
    lw=Math.max(WT[0][1],Math.min(WT[WT.length-1][1],lw));
    for(var i=1;i<WT.length;i++){
      if(lw<=WT[i][1]){var t=(lw-WT[i-1][1])/(WT[i][1]-WT[i-1][1]);return WT[i-1][0]+t*(WT[i][0]-WT[i-1][0]);}
    } return 1;
  }
  function l10(p){
    p=Math.max(0.001,Math.min(0.999,p));
    for(var i=1;i<WT.length;i++){
      if(p<=WT[i][0]){var t=(p-WT[i-1][0])/(WT[i][0]-WT[i-1][0]);return WT[i-1][1]+t*(WT[i][1]-WT[i-1][1]);}
    } return WT[WT.length-1][1];
  }
  function dens(lw){return(pct5(lw+0.06)-pct5(lw-0.06))/0.12;}
  function fmt(lw){var w=Math.pow(10,lw);return w>=1e6?'$'+(w/1e6).toFixed(1)+'M':w>=1e3?'$'+Math.round(w/1000)+'k':'$'+Math.round(w);}

  // ── linear-scale helpers ────────────────────────────────────
  var linMax = 1200000;
  function sXlin(w){ return pl + Math.max(0, Math.min(1, w/linMax)) * pw; }
  function iXlin(sx){ return Math.max(0, (sx-pl)/pw * linMax); }
  function densLin(w){
    if(w < 300) return 0;
    var lw=Math.log10(w), d=0.05;
    var wHi=Math.pow(10,lw+d), wLo=Math.pow(10,lw-d);
    return (pct5(lw+d)-pct5(lw-d))/(wHi-wLo);
  }

  var isLog = false;
  var currentLW = 5.29; // log10 of initial position (~$193k median)

  // ── draw log view (original) ────────────────────────────────
  function drawLog(){
    var N=200, pts=[], maxD=0;
    for(var i=0;i<=N;i++){var lw=xMin+(xMax-xMin)*i/N,d=dens(lw);pts.push([lw,d]);if(d>maxD)maxD=d;}
    function pY(d){return pt+ph-(d/maxD)*ph*0.90;}
    var zones=[
      {lo:xMin,      hi:l10(0.50),fill:'rgba(160,60,30,0.13)', lbl:'Bottom 50%',lc:'rgba(140,40,20,0.8)'},
      {lo:l10(0.50), hi:l10(0.90),fill:'rgba(160,120,30,0.12)',lbl:'50th\u201390th',lc:'rgba(140,100,20,0.8)'},
      {lo:l10(0.90), hi:l10(0.99),fill:'rgba(50,130,70,0.14)', lbl:'90th\u201399th',lc:'rgba(30,110,50,0.8)'},
      {lo:l10(0.99), hi:xMax,     fill:'rgba(30,90,170,0.16)', lbl:'Top 1%',    lc:'rgba(20,70,150,0.8)'},
    ];
    var h='<rect width="'+W+'" height="'+H+'" fill="#fafaf8"/>';
    zones.forEach(function(z){
      var x1=sX(z.lo),x2=sX(z.hi);
      h+='<rect x="'+x1.toFixed(1)+'" y="'+pt+'" width="'+(x2-x1).toFixed(1)+'" height="'+ph+'" fill="'+z.fill+'"/>';
    });
    for(var e=2;e<=7;e++){
      var x=sX(e),lb=['$100','$1k','$10k','$100k','$1M','$10M'][e-2];
      h+='<line x1="'+x.toFixed(1)+'" y1="'+pt+'" x2="'+x.toFixed(1)+'" y2="'+(pt+ph)+'" stroke="#e0e8d8" stroke-width="0.5"/>';
      h+='<text x="'+x.toFixed(1)+'" y="'+(pt+ph+14)+'" text-anchor="middle" font-family="Spectral,serif" font-size="10" fill="#7a7060">'+lb+'</text>';
    }
    var area='M'+sX(xMin).toFixed(1)+','+(pt+ph);
    pts.forEach(function(p2){area+=' L'+sX(p2[0]).toFixed(1)+','+pY(p2[1]).toFixed(1);});
    area+=' L'+sX(xMax).toFixed(1)+','+(pt+ph)+' Z';
    h+='<path d="'+area+'" fill="rgba(100,130,80,0.10)"/>';
    var crv='';
    pts.forEach(function(p2,i){crv+=(i?'L':'M')+sX(p2[0]).toFixed(1)+','+pY(p2[1]).toFixed(1)+' ';});
    h+='<path d="'+crv+'" fill="none" stroke="#5a7a4a" stroke-width="1.8"/>';
    h+='<line x1="'+pl+'" y1="'+pt+'" x2="'+pl+'" y2="'+(pt+ph)+'" stroke="#999" stroke-width="0.8"/>';
    h+='<line x1="'+pl+'" y1="'+(pt+ph)+'" x2="'+(pl+pw)+'" y2="'+(pt+ph)+'" stroke="#999" stroke-width="0.8"/>';
    var mX=sX(5.29);
    h+='<line x1="'+mX.toFixed(1)+'" y1="'+pt+'" x2="'+mX.toFixed(1)+'" y2="'+(pt+ph)+'" stroke="#8b3a1e" stroke-width="1.2" stroke-dasharray="4,3" opacity="0.8"/>';
    h+='<text x="'+(mX+4).toFixed(1)+'" y="'+(pt+16)+'" font-family="Spectral,serif" font-style="italic" font-size="9" fill="#8b3a1e">median $193k</text>';
    var mnX=sX(Math.log10(1060000));
    h+='<line x1="'+mnX.toFixed(1)+'" y1="'+pt+'" x2="'+mnX.toFixed(1)+'" y2="'+(pt+ph)+'" stroke="#2d6e8a" stroke-width="1.2" stroke-dasharray="4,3" opacity="0.8"/>';
    h+='<text x="'+(mnX+4).toFixed(1)+'" y="'+(pt+28)+'" font-family="Spectral,serif" font-style="italic" font-size="9" fill="#2d6e8a">mean $1.06M</text>';
    zones.forEach(function(z){
      var mx=(sX(z.lo)+sX(z.hi))/2;
      h+='<text x="'+mx.toFixed(1)+'" y="'+(pt+ph-8)+'" text-anchor="middle" font-family="Spectral,serif" font-size="9" fill="'+z.lc+'">'+z.lbl+'</text>';
    });
    h+='<text x="'+(pl+6)+'" y="'+(pt+10)+'" font-family="Spectral,serif" font-size="8.5" fill="#8b3a1e" font-style="italic">\u2190 11% have $0 or debt</text>';
    h+='<text x="'+(pl+pw/2)+'" y="'+(H-5)+'" text-anchor="middle" font-family="Spectral,serif" font-style="italic" font-size="11" fill="#3d4144">Net Worth (log scale)</text>';
    // interactive marker
    var iLx=sX(currentLW);
    h+='<line id="v5-line" x1="'+iLx.toFixed(1)+'" y1="'+pt+'" x2="'+iLx.toFixed(1)+'" y2="'+(pt+ph)+'" stroke="#1a1d1e" stroke-width="2"/>';
    h+='<circle id="v5-dot" cx="'+iLx.toFixed(1)+'" cy="'+(pt+ph/2)+'" r="6" fill="#1a1d1e" stroke="white" stroke-width="2" style="cursor:ew-resize"/>';
    h+='<rect id="v5-lbg" x="0" y="0" width="1" height="16" fill="rgba(26,29,30,0.88)" rx="2"/>';
    h+='<text id="v5-ltxt" x="0" y="0" font-family="Spectral,serif" font-size="9.5" fill="white" font-style="italic"></text>';
    svg.innerHTML=h; svg.style.cursor='ew-resize';
  }

  // ── draw linear view (new) ──────────────────────────────────
  function drawLinear(){
    var N=300, pts=[], maxD=0;
    for(var i=0;i<=N;i++){
      var w=500+(linMax-500)*i/N, d=densLin(w);
      pts.push([w,d]); if(d>maxD) maxD=d;
    }
    function pY(d){return pt+ph-(d/maxD)*ph*0.90;}
    var h='<rect width="'+W+'" height="'+H+'" fill="#fafaf8"/>';
    // zone shading: bottom 50% and upper
    h+='<rect x="'+pl+'" y="'+pt+'" width="'+(sXlin(193000)-pl).toFixed(1)+'" height="'+ph+'" fill="rgba(160,60,30,0.10)"/>';
    h+='<rect x="'+sXlin(193000).toFixed(1)+'" y="'+pt+'" width="'+(pl+pw-sXlin(193000)).toFixed(1)+'" height="'+ph+'" fill="rgba(160,120,30,0.07)"/>';
    // grid lines
    [0,200000,400000,600000,800000,1000000].forEach(function(w2){
      var x=sXlin(w2);
      h+='<line x1="'+x.toFixed(1)+'" y1="'+pt+'" x2="'+x.toFixed(1)+'" y2="'+(pt+ph)+'" stroke="#e0e8d8" stroke-width="0.5"/>';
      var lb=w2===0?'$0':w2>=1000000?'$'+(w2/1000000).toFixed(0)+'M':'$'+Math.round(w2/1000)+'k';
      h+='<text x="'+x.toFixed(1)+'" y="'+(pt+ph+14)+'" text-anchor="middle" font-family="Spectral,serif" font-size="10" fill="#7a7060">'+lb+'</text>';
    });
    // fill + curve
    var area='M'+pl.toFixed(1)+','+(pt+ph);
    pts.forEach(function(p2){area+=' L'+sXlin(p2[0]).toFixed(1)+','+pY(p2[1]).toFixed(1);});
    area+=' L'+(pl+pw).toFixed(1)+','+(pt+ph)+' Z';
    h+='<path d="'+area+'" fill="rgba(100,130,80,0.10)"/>';
    var crv='';
    pts.forEach(function(p2,i){crv+=(i?'L':'M')+sXlin(p2[0]).toFixed(1)+','+pY(p2[1]).toFixed(1)+' ';});
    h+='<path d="'+crv+'" fill="none" stroke="#5a7a4a" stroke-width="1.8"/>';
    // axes
    h+='<line x1="'+pl+'" y1="'+pt+'" x2="'+pl+'" y2="'+(pt+ph)+'" stroke="#999" stroke-width="0.8"/>';
    h+='<line x1="'+pl+'" y1="'+(pt+ph)+'" x2="'+(pl+pw)+'" y2="'+(pt+ph)+'" stroke="#999" stroke-width="0.8"/>';
    // median line
    var mX=sXlin(193000);
    h+='<line x1="'+mX.toFixed(1)+'" y1="'+pt+'" x2="'+mX.toFixed(1)+'" y2="'+(pt+ph)+'" stroke="#8b3a1e" stroke-width="1.2" stroke-dasharray="4,3" opacity="0.8"/>';
    h+='<text x="'+(mX+4).toFixed(1)+'" y="'+(pt+16)+'" font-family="Spectral,serif" font-style="italic" font-size="9" fill="#8b3a1e">median $193k</text>';
    // mean is beyond chart - annotate at right edge
    h+='<line x1="'+(pl+pw).toFixed(1)+'" y1="'+pt+'" x2="'+(pl+pw).toFixed(1)+'" y2="'+(pt+ph)+'" stroke="#2d6e8a" stroke-width="1" stroke-dasharray="3,3" opacity="0.6"/>';
    h+='<text x="'+(pl+pw-4).toFixed(1)+'" y="'+(pt+28)+'" text-anchor="end" font-family="Spectral,serif" font-style="italic" font-size="8.5" fill="#2d6e8a">mean $1.06M \u2192</text>';
    // zone labels
    h+='<text x="'+(sXlin(96500)).toFixed(1)+'" y="'+(pt+ph-8)+'" text-anchor="middle" font-family="Spectral,serif" font-size="9" fill="rgba(140,40,20,0.8)">Bottom 50%</text>';
    h+='<text x="'+(sXlin(696500)).toFixed(1)+'" y="'+(pt+ph-8)+'" text-anchor="middle" font-family="Spectral,serif" font-size="9" fill="rgba(140,100,20,0.8)">Upper half</text>';
    // annotations
    h+='<text x="'+(pl+6)+'" y="'+(pt+10)+'" font-family="Spectral,serif" font-size="8.5" fill="#8b3a1e" font-style="italic">\u2190 11% have $0 or debt</text>';
    h+='<text x="'+(pl+pw-4).toFixed(1)+'" y="'+(pt+ph/2)+'" text-anchor="end" font-family="Spectral,serif" font-size="8" fill="#8b3a1e" font-style="italic">top 20% extends beyond \u2192</text>';
    h+='<text x="'+(pl+pw/2)+'" y="'+(H-5)+'" text-anchor="middle" font-family="Spectral,serif" font-style="italic" font-size="11" fill="#3d4144">Net Worth (linear scale, $0\u2013$1.2M)</text>';
    // interactive marker
    var iw=Math.min(Math.pow(10,currentLW), linMax*0.98);
    var iLx=sXlin(iw);
    h+='<line id="v5-line" x1="'+iLx.toFixed(1)+'" y1="'+pt+'" x2="'+iLx.toFixed(1)+'" y2="'+(pt+ph)+'" stroke="#1a1d1e" stroke-width="2"/>';
    h+='<circle id="v5-dot" cx="'+iLx.toFixed(1)+'" cy="'+(pt+ph/2)+'" r="6" fill="#1a1d1e" stroke="white" stroke-width="2" style="cursor:ew-resize"/>';
    h+='<rect id="v5-lbg" x="0" y="0" width="1" height="16" fill="rgba(26,29,30,0.88)" rx="2"/>';
    h+='<text id="v5-ltxt" x="0" y="0" font-family="Spectral,serif" font-size="9.5" fill="white" font-style="italic"></text>';
    svg.innerHTML=h; svg.style.cursor='ew-resize';
  }

  // ── unified update (position label) ────────────────────────
  function upd(lw){
    lw=Math.max(xMin+0.05,Math.min(xMax-0.05,lw));
    currentLW=lw;
    var w=Math.pow(10,lw);
    var x=isLog ? sX(lw) : Math.min(sXlin(w), pl+pw-4);
    var p=(pct5(lw)*100).toFixed(0), txt=fmt(lw)+' \u00b7 p'+p, bw=txt.length*5.8+10;
    var lx=Math.min(x+5,pl+pw-bw-2);
    var ln=document.getElementById('v5-line');
    var dt=document.getElementById('v5-dot');
    var lb=document.getElementById('v5-lbg');
    var lt=document.getElementById('v5-ltxt');
    if(!ln) return;
    ln.setAttribute('x1',x.toFixed(1)); ln.setAttribute('x2',x.toFixed(1));
    dt.setAttribute('cx',x.toFixed(1));
    lb.setAttribute('x',lx.toFixed(1)); lb.setAttribute('y',(pt+3).toFixed(1)); lb.setAttribute('width',bw.toFixed(0));
    lt.setAttribute('x',(lx+5).toFixed(1)); lt.setAttribute('y',(pt+14).toFixed(1)); lt.textContent=txt;
    var el=document.getElementById('v5-label'); if(el) el.textContent=fmt(lw)+' \u00b7 p'+p;
  }

  // ── event helpers ───────────────────────────────────────────
  var drag5=false;
  function getLW(e){
    var r=svg.getBoundingClientRect();
    var svgX=(e.clientX-r.left)*W/r.width;
    if(isLog) return iX(svgX);
    var w=Math.max(500, iXlin(svgX));
    return Math.log10(w);
  }
  svg.addEventListener('mousedown',  function(e){drag5=true; upd(getLW(e));});
  svg.addEventListener('mousemove',  function(e){if(drag5) upd(getLW(e));});
  svg.addEventListener('mouseup',    function(){drag5=false;});
  svg.addEventListener('mouseleave', function(){drag5=false;});
  svg.addEventListener('touchstart', function(e){e.preventDefault();drag5=true;upd(getLW(e.touches[0]));},{passive:false});
  svg.addEventListener('touchmove',  function(e){e.preventDefault();if(drag5)upd(getLW(e.touches[0]));},{passive:false});
  svg.addEventListener('touchend',   function(){drag5=false;});

  var sl=document.getElementById('v5-slider');
  if(sl) sl.addEventListener('input',function(){upd(l10(Math.max(0.11,sl.value/100)));});

  // ── toggle button ───────────────────────────────────────────
  var toggleBtn=document.getElementById('v5-toggle');
  if(toggleBtn){
    toggleBtn.addEventListener('click',function(){
      isLog=!isLog;
      toggleBtn.textContent=isLog ? '\u2190 Back to linear scale' : 'Try log scale \u2192';
      if(isLog) drawLog(); else drawLinear();
      upd(currentLW);
    });
  }

  // ── initial render ──────────────────────────────────────────
  drawLinear();
  upd(currentLW);
})();

/* ============================================================
   FIGURE 6 - PRIVILEGE SIMULATOR (self-contained IIFE)
   ============================================================ */
(function() {
'use strict';

/* ================================================================
   CONSTANTS & MODEL
   ================================================================ */

let   B_IQ    = 0.35;
const B_CONSC   = 0.25;
const B_WEALTH  = 0.45;
const RESID_SD  = 0.70;
const RHO_TRAITS = 0.25;   // IQ–conscientiousness correlation
const H2_IQ     = 0.60;   // IQ heritability
const H2_CONSC  = 0.45;   // conscientiousness heritability
const IND_INCOME_MEDIAN = 40000;   // individual income anchor ($)
const LOG_INCOME_SD     = 0.90;    // log-normal SD for income
const WEALTH_LOG_MEAN   = 5.20;    // log10($160k) ≈ median positive wealth
const WEALTH_LOG_SD     = 1.05;    // SD of log10(wealth)
const N_SAMPLES  = 350;
const ANIM_RATE  = 7;     // samples added per animation frame

// SCF 2022 wealth percentile lookup [percentile (0-1), log10(dollars)]
const WEALTH_TABLE = [
  [0.00, 1.0], [0.11, 2.0], [0.20, 3.70], [0.30, 4.45], [0.40, 4.92],
  [0.50, 5.29], [0.60, 5.53], [0.70, 5.77], [0.80, 6.00],
  [0.90, 6.40], [0.95, 6.71], [0.99, 7.04], [1.00, 7.70]
];
// Wealth threshold: below $20k, no compound savings possible (paycheck-to-paycheck)
// Below $1k: debt erosion
const WEALTH_ACCUM_THRESHOLD = 20000;
const WEALTH_DEBT_THRESHOLD  = 1000;
const IQ_SAVINGS_SLOPE       = 0.04;  // each SD IQ above mean → +4pp savings rate

/* ================================================================
   MATH UTILITIES
   ================================================================ */
let _spareNormal = null;
function randNormal() {
  if (_spareNormal !== null) { const v = _spareNormal; _spareNormal = null; return v; }
  let u, v, s;
  do { u = Math.random()*2-1; v = Math.random()*2-1; s = u*u+v*v; } while (s>=1||s===0);
  const m = Math.sqrt(-2*Math.log(s)/s);
  _spareNormal = v * m;
  return u * m;
}

const ERF_A = [0.254829592, -0.284496736, 1.421413741, -1.453152027, 1.061405429];
const ERF_P = 0.3275911;
function erf(x) {
  const sign = x < 0 ? -1 : 1; x = Math.abs(x);
  const t = 1/(1+ERF_P*x);
  return sign*(1-(((((ERF_A[4]*t+ERF_A[3])*t+ERF_A[2])*t+ERF_A[1])*t+ERF_A[0])*t)*Math.exp(-x*x));
}
function normalCDF(x) { return 0.5*(1+erf(x/Math.SQRT2)); }
function normalPDF(x) { return Math.exp(-0.5*x*x)/Math.sqrt(2*Math.PI); }

// Rational approximation of inverse normal CDF (Beasley-Springer-Moro)
function probit(p) {
  if (p <= 0.0001) return -3.8; if (p >= 0.9999) return 3.8;
  const a=[-3.969683028665376e1,2.209460984245205e2,-2.759285104469687e2,1.383577518672690e2,-3.066479806614716e1,2.506628277459239];
  const b=[-5.447609879822406e1,1.615858368580409e2,-1.556989798598866e2,6.680131188771972e1,-1.328068155288572e1];
  const c=[-7.784894002430293e-3,-3.223964580411365e-1,-2.400758277161838,-2.549732539343734,4.374664141464968,2.938163982698783];
  const d=[7.784695709041462e-3,3.224671290700398e-1,2.445134137142996,3.754408661907416];
  const pL=0.02425, pH=1-pL;
  let q,r;
  if (p<pL){ q=Math.sqrt(-2*Math.log(p)); return (((((c[0]*q+c[1])*q+c[2])*q+c[3])*q+c[4])*q+c[5])/((((d[0]*q+d[1])*q+d[2])*q+d[3])*q+1); }
  if (p<=pH){ q=p-0.5; r=q*q; return (((((a[0]*r+a[1])*r+a[2])*r+a[3])*r+a[4])*r+a[5])*q/(((((b[0]*r+b[1])*r+b[2])*r+b[3])*r+b[4])*r+1); }
  q=Math.sqrt(-2*Math.log(1-p)); return -(((((c[0]*q+c[1])*q+c[2])*q+c[3])*q+c[4])*q+c[5])/((((d[0]*q+d[1])*q+d[2])*q+d[3])*q+1);
}

function log10FromPctile(p) {
  p = Math.max(0.001, Math.min(0.999, p));
  for (let i=1; i<WEALTH_TABLE.length; i++) {
    if (p <= WEALTH_TABLE[i][0]) {
      const t = (p-WEALTH_TABLE[i-1][0])/(WEALTH_TABLE[i][0]-WEALTH_TABLE[i-1][0]);
      return WEALTH_TABLE[i-1][1] + t*(WEALTH_TABLE[i][1]-WEALTH_TABLE[i-1][1]);
    }
  }
  return WEALTH_TABLE[WEALTH_TABLE.length-1][1];
}
function pctileFromLog10(lw) {
  lw = Math.max(WEALTH_TABLE[0][1], Math.min(WEALTH_TABLE[WEALTH_TABLE.length-1][1], lw));
  for (let i=1; i<WEALTH_TABLE.length; i++) {
    if (lw <= WEALTH_TABLE[i][1]) {
      const t=(lw-WEALTH_TABLE[i-1][1])/(WEALTH_TABLE[i][1]-WEALTH_TABLE[i-1][1]);
      return WEALTH_TABLE[i-1][0]+t*(WEALTH_TABLE[i][0]-WEALTH_TABLE[i-1][0]);
    }
  }
  return 1.0;
}

function wealthZFromLog10(lw) { return (lw - WEALTH_LOG_MEAN) / WEALTH_LOG_SD; }
function dollarsFromLog10(lw) { return Math.pow(10, lw); }
function formatDollars(d) {
  if (d >= 1e6) return '$' + (d/1e6).toFixed(1) + 'M';
  if (d >= 1e3) return '$' + Math.round(d/1000) + 'k';
  return '$' + Math.round(d);
}

/* ================================================================
   INCOME MODEL
   ================================================================ */
function computeIndividualIncome(iqZ, conscZ, wealthLog) {
  const wZ = wealthZFromLog10(wealthLog);
  const outcomeZ = B_IQ*iqZ + B_CONSC*conscZ + B_WEALTH*wZ + randNormal()*RESID_SD;
  return IND_INCOME_MEDIAN * Math.exp(outcomeZ * LOG_INCOME_SD);
}

function onBIQChange(val) { B_IQ = val / 100; document.getElementById('sim-biq-val').textContent = B_IQ.toFixed(2); }

function computePartner(iqZ, conscZ, wealthLog, am) {
  const sq = Math.sqrt(1 - am*am);
  const partnerIQ    = am * iqZ    + sq * randNormal();
  const partnerConsc = am * conscZ + sq * randNormal();
  // partner wealth: correlate in LOG space
  const personWZ = wealthZFromLog10(wealthLog);
  const partnerWZ = am * personWZ + sq * randNormal();
  const partnerWLog = WEALTH_LOG_MEAN + partnerWZ * WEALTH_LOG_SD;
  return { iqZ: partnerIQ, conscZ: partnerConsc, wealthLog: partnerWLog };
}

function computeChildGen(personIQ, personConsc, personWLog, partnerIQ, partnerConsc, partnerWLog, householdIncome) {
  // Trait midpoint regression
  const midIQ    = (personIQ + partnerIQ) / 2;
  const midConsc = (personConsc + partnerConsc) / 2;
  const childIQ    = midIQ    * Math.sqrt(H2_IQ)    + randNormal() * Math.sqrt(1 - H2_IQ/2);
  const childConsc = midConsc * Math.sqrt(H2_CONSC) + randNormal() * Math.sqrt(1 - H2_CONSC/2);

  // Wealth: threshold-gated compounding + IQ-adjusted savings
  const avgParentWealth = (Math.pow(10, personWLog) + Math.pow(10, partnerWLog)) / 2;
  const avgParentIQ     = (personIQ + partnerIQ) / 2;

  // Capital growth is threshold-gated: only above $20k can wealth compound
  let wealthGrow;
  if (avgParentWealth < WEALTH_DEBT_THRESHOLD)       wealthGrow = 0.85;  // debt erosion
  else if (avgParentWealth < WEALTH_ACCUM_THRESHOLD) wealthGrow = 1.0;   // no growth
  else                                               wealthGrow = 1.5;   // capital appreciates

  // Savings rate scales with IQ, but only above the accumulation threshold
  const savingsRate = avgParentWealth >= WEALTH_ACCUM_THRESHOLD
    ? Math.max(0, 0.12 + IQ_SAVINGS_SLOPE * avgParentIQ)
    : 0;

  const inheritedWealth = 0.85 * avgParentWealth * wealthGrow;
  const lifetimeSavings = householdIncome * 40 * savingsRate;
  const childWealth     = inheritedWealth + 0.15 * lifetimeSavings;
  const childWLog       = Math.log10(Math.max(100, childWealth));

  return { iqZ: childIQ, conscZ: childConsc, wealthLog: childWLog };
}

/* ================================================================
   STATE
   ================================================================ */
const state = {
  active: 'A',
  am: 0.70,
  gen: 0,
  sets: {
    A: {
      traitRect:  { x0: 0.5, y0: 0.5, x1: 2.5, y1: 2.5 },  // IQ z, consc z
      wealthRange: { lo: 0.45, hi: 0.65 },                   // percentile 0-1
      samples: [],
      color: '#8b3a1e',
      colorLight: 'rgba(139,58,30,0.15)',
    },
    B: {
      traitRect:  { x0: -0.5, y0: -0.5, x1: 1.0, y1: 1.0 },
      wealthRange: { lo: 0.70, hi: 0.90 },
      samples: [],
      color: '#1a5c8a',
      colorLight: 'rgba(26,92,138,0.15)',
    }
  },
  animating: false,
  animTarget: null,  // 'A' or 'B'
  animIdx: 0,
  pendingSamples: [],
};

/* ================================================================
   TRAIT CANVAS
   ================================================================ */
const traitCanvas = document.getElementById('sim-trait-canvas');
const traitCtx    = traitCanvas.getContext('2d');
const TC = { W: 500, H: 420, l: 55, t: 20, r: 20, b: 45 };
TC.pw = TC.W - TC.l - TC.r;
TC.ph = TC.H - TC.t - TC.b;
const T_MIN = -3.5, T_MAX = 3.5;
function tCx(z) { return TC.l + (z - T_MIN) / (T_MAX - T_MIN) * TC.pw; }
function tCy(z) { return TC.t + (1 - (z - T_MIN) / (T_MAX - T_MIN)) * TC.ph; }
function tInvX(px) { return T_MIN + (px - TC.l) / TC.pw * (T_MAX - T_MIN); }
function tInvY(py) { return T_MAX - (py - TC.t) / TC.ph * (T_MAX - T_MIN); }

let traitGaussianCache = null;
function buildTraitCache() {
  const img = traitCtx.createImageData(TC.W, TC.H);
  const d = img.data;
  const maxPDF = 1 / (2*Math.PI*Math.sqrt(1-RHO_TRAITS*RHO_TRAITS));
  for (let py = 0; py < TC.H; py++) {
    for (let px = 0; px < TC.W; px++) {
      const idx = (py*TC.W+px)*4;
      if (px < TC.l || px > TC.l+TC.pw || py < TC.t || py > TC.t+TC.ph) {
        d[idx]=250;d[idx+1]=250;d[idx+2]=250;d[idx+3]=255; continue;
      }
      const x = tInvX(px), y = tInvY(py);
      const q = (x*x - 2*RHO_TRAITS*x*y + y*y) / (2*(1-RHO_TRAITS*RHO_TRAITS));
      const pdf = Math.exp(-q) / (2*Math.PI*Math.sqrt(1-RHO_TRAITS*RHO_TRAITS));
      const t = Math.pow(pdf/maxPDF, 0.45);
      d[idx]   = Math.round(235 + (90-235)*t);
      d[idx+1] = Math.round(240 + (165-240)*t);
      d[idx+2] = Math.round(250 + (220-250)*t);
      d[idx+3] = 255;
    }
  }
  traitGaussianCache = img;
}

function drawTraitPanel() {
  if (!traitGaussianCache) buildTraitCache();
  traitCtx.putImageData(traitGaussianCache, 0, 0);

  // Grid & axes
  traitCtx.strokeStyle = '#cce'; traitCtx.lineWidth = 0.4;
  for (let v = -3; v <= 3; v++) {
    const cx2 = tCx(v), cy2 = tCy(v);
    if (v !== 0) {
      traitCtx.beginPath(); traitCtx.moveTo(cx2, TC.t); traitCtx.lineTo(cx2, TC.t+TC.ph); traitCtx.stroke();
      traitCtx.beginPath(); traitCtx.moveTo(TC.l, cy2); traitCtx.lineTo(TC.l+TC.pw, cy2); traitCtx.stroke();
    }
  }
  traitCtx.strokeStyle = '#aab'; traitCtx.lineWidth = 0.8;
  traitCtx.beginPath(); traitCtx.moveTo(TC.l, TC.t); traitCtx.lineTo(TC.l, TC.t+TC.ph); traitCtx.stroke();
  traitCtx.beginPath(); traitCtx.moveTo(TC.l, TC.t+TC.ph); traitCtx.lineTo(TC.l+TC.pw, TC.t+TC.ph); traitCtx.stroke();

  // Tick labels
  traitCtx.fillStyle='#8a9'; traitCtx.font='11px Spectral,serif'; traitCtx.textAlign='center';
  for (let v = -3; v <= 3; v++) {
    if (v === 0) continue;
    const cx2 = tCx(v); const iqPt = Math.round(100 + v*15);
    traitCtx.fillText(v+'σ', cx2, TC.t+TC.ph+14);
    traitCtx.fillStyle='#8a9'; traitCtx.textAlign='right';
    traitCtx.fillText(v+'σ', TC.l-5, tCy(v)+4);
    traitCtx.textAlign='center';
  }
  // IQ labels
  traitCtx.fillStyle='#556'; traitCtx.font='italic 10px Spectral,serif';
  [-2,-1,0,1,2].forEach(v => {
    traitCtx.fillText('IQ '+(100+v*15), tCx(v), TC.t+TC.ph+26);
  });
  traitCtx.fillStyle='#556'; traitCtx.font='italic 12px Lato,sans-serif'; traitCtx.textAlign='center';
  traitCtx.fillText('IQ (z-score)', TC.l+TC.pw/2, TC.H-3);
  traitCtx.save(); traitCtx.translate(13, TC.t+TC.ph/2); traitCtx.rotate(-Math.PI/2);
  traitCtx.fillText('Conscientiousness', 0, 0); traitCtx.restore();

  // Draw both selection rectangles
  ['B','A'].forEach(key => {
    const s = state.sets[key];
    const r = s.traitRect;
    const x1 = tCx(r.x0), y1 = tCy(r.y1);  // note y is flipped
    const x2 = tCx(r.x1), y2 = tCy(r.y0);
    const w = x2-x1, h = y2-y1;
    // Fill
    traitCtx.fillStyle = s.colorLight;
    traitCtx.fillRect(x1, y1, w, h);
    // Border
    traitCtx.strokeStyle = s.color;
    traitCtx.lineWidth = key === state.active ? 2.5 : 1.5;
    traitCtx.setLineDash(key === state.active ? [] : [5,4]);
    traitCtx.strokeRect(x1, y1, w, h);
    traitCtx.setLineDash([]);
    // Label
    traitCtx.fillStyle = s.color;
    traitCtx.font = 'bold 11px Lato,sans-serif'; traitCtx.textAlign='left';
    traitCtx.fillText('Set '+key, x1+4, y1+14);
  });

  // Draw sampled dots (recent samples for current active set)
  ['A','B'].forEach(key => {
    const s = state.sets[key];
    const recent = s.samples.slice(-60);
    recent.forEach((sp, i) => {
      const alpha = (i / recent.length) * 0.6 + 0.1;
      traitCtx.beginPath();
      traitCtx.arc(tCx(sp.iqZ), tCy(sp.conscZ), 2.5, 0, 2*Math.PI);
      traitCtx.fillStyle = s.color.replace(')', `,${alpha.toFixed(2)})`).replace('rgb', 'rgba').replace('#8b3a1e', `rgba(139,58,30,${alpha.toFixed(2)})`).replace('#1a5c8a', `rgba(26,92,138,${alpha.toFixed(2)})`);
      traitCtx.fill();
    });
  });
}

/* ================================================================
   WEALTH CANVAS
   ================================================================ */
const wealthCanvas = document.getElementById('sim-wealth-canvas');
const wealthCtx    = wealthCanvas.getContext('2d');
const WC = { W: 500, H: 420, l: 55, t: 20, r: 20, b: 45 };
WC.pw = WC.W - WC.l - WC.r;
WC.ph = WC.H - WC.t - WC.b;
const W_LOG_MIN = 1.5, W_LOG_MAX = 7.8;
function wCx(log10w) { return WC.l + (log10w - W_LOG_MIN) / (W_LOG_MAX - W_LOG_MIN) * WC.pw; }
function wInvX(px)   { return W_LOG_MIN + (px - WC.l) / WC.pw * (W_LOG_MAX - W_LOG_MIN); }

let wealthDensity = null;
function buildWealthDensity() {
  const N = 300;
  const pts = [];
  let maxD = 0;
  for (let i = 0; i <= N; i++) {
    const lw = W_LOG_MIN + (W_LOG_MAX - W_LOG_MIN) * i / N;
    const p1 = pctileFromLog10(lw - 0.06);
    const p2 = pctileFromLog10(lw + 0.06);
    const d = (p2 - p1) / 0.12;
    pts.push([lw, d]);
    if (d > maxD) maxD = d;
  }
  wealthDensity = { pts, maxD };
}

function drawWealthPanel() {
  if (!wealthDensity) buildWealthDensity();
  const { pts, maxD } = wealthDensity;

  wealthCtx.clearRect(0, 0, WC.W, WC.H);
  wealthCtx.fillStyle = '#f9f9f8';
  wealthCtx.fillRect(0, 0, WC.W, WC.H);

  // Vertical grid
  for (let e = 2; e <= 7; e++) {
    const x = wCx(e);
    wealthCtx.strokeStyle = '#e0e8e0'; wealthCtx.lineWidth = 0.5;
    wealthCtx.beginPath(); wealthCtx.moveTo(x, WC.t); wealthCtx.lineTo(x, WC.t+WC.ph); wealthCtx.stroke();
  }
  // Axis
  wealthCtx.strokeStyle = '#aab'; wealthCtx.lineWidth = 0.8;
  wealthCtx.beginPath(); wealthCtx.moveTo(WC.l, WC.t); wealthCtx.lineTo(WC.l, WC.t+WC.ph); wealthCtx.stroke();
  wealthCtx.beginPath(); wealthCtx.moveTo(WC.l, WC.t+WC.ph); wealthCtx.lineTo(WC.l+WC.pw, WC.t+WC.ph); wealthCtx.stroke();

  // Both selection brackets (drawn first, behind)
  ['B','A'].forEach(key => {
    const s = state.sets[key];
    const x1 = wCx(log10FromPctile(s.wealthRange.lo));
    const x2 = wCx(log10FromPctile(s.wealthRange.hi));
    wealthCtx.fillStyle = s.colorLight;
    wealthCtx.fillRect(x1, WC.t, x2-x1, WC.ph);
  });

  // Density area
  wealthCtx.beginPath();
  wealthCtx.moveTo(wCx(W_LOG_MIN), WC.t+WC.ph);
  pts.forEach(([lw,d]) => wealthCtx.lineTo(wCx(lw), WC.t + WC.ph - (d/maxD)*WC.ph*0.88));
  wealthCtx.lineTo(wCx(W_LOG_MAX), WC.t+WC.ph);
  wealthCtx.closePath();
  wealthCtx.fillStyle = 'rgba(100,140,100,0.12)'; wealthCtx.fill();
  wealthCtx.strokeStyle = '#5a8a5a'; wealthCtx.lineWidth = 1.5;
  wealthCtx.beginPath();
  pts.forEach(([lw,d],i) => { const px=wCx(lw), py=WC.t+WC.ph-(d/maxD)*WC.ph*0.88; i===0?wealthCtx.moveTo(px,py):wealthCtx.lineTo(px,py); });
  wealthCtx.stroke();

  // Selection brackets: borders & handles
  ['A','B'].forEach(key => {
    const s = state.sets[key];
    const x1 = wCx(log10FromPctile(s.wealthRange.lo));
    const x2 = wCx(log10FromPctile(s.wealthRange.hi));
    wealthCtx.strokeStyle = s.color;
    wealthCtx.lineWidth = key === state.active ? 2.5 : 1.5;
    wealthCtx.setLineDash(key === state.active ? [] : [5,4]);
    wealthCtx.strokeRect(x1, WC.t, x2-x1, WC.ph);
    wealthCtx.setLineDash([]);
    // Handles
    [[x1,'◄'],[x2,'►']].forEach(([hx, sym]) => {
      wealthCtx.fillStyle = s.color;
      wealthCtx.fillRect(hx-5, WC.t+WC.ph/2-10, 10, 20);
      wealthCtx.fillStyle='white'; wealthCtx.font='8px sans-serif'; wealthCtx.textAlign='center';
      wealthCtx.fillText('║', hx, WC.t+WC.ph/2+3);
    });
    // Label
    const midX = (x1+x2)/2;
    wealthCtx.fillStyle=s.color; wealthCtx.font='bold 10px Lato'; wealthCtx.textAlign='center';
    wealthCtx.fillText('Set '+key, midX, WC.t+12);
    const loD = formatDollars(dollarsFromLog10(log10FromPctile(s.wealthRange.lo)));
    const hiD = formatDollars(dollarsFromLog10(log10FromPctile(s.wealthRange.hi)));
    wealthCtx.font='9px Spectral,serif'; wealthCtx.fillStyle=s.color;
    wealthCtx.fillText(`${loD} – ${hiD}`, midX, WC.t+24);
  });

  // X labels
  wealthCtx.fillStyle='#556'; wealthCtx.font='10px Spectral,serif'; wealthCtx.textAlign='center';
  const xlabels = {2:'$100',3:'$1k',4:'$10k',5:'$100k',6:'$1M',7:'$10M'};
  for (let e=2; e<=7; e++) wealthCtx.fillText(xlabels[e], wCx(e), WC.t+WC.ph+16);

  wealthCtx.fillStyle='#556'; wealthCtx.font='italic 12px Lato'; wealthCtx.textAlign='center';
  wealthCtx.fillText('Starting Net Worth (log scale)', WC.l+WC.pw/2, WC.H-3);

  // Reference lines
  const refs = [{v: 5.29, label:'Median $193k', col:'#888'}, {v:Math.log10(1060000), label:'Mean $1.06M', col:'#5a8'}];
  refs.forEach(({v,label,col}) => {
    const x = wCx(v);
    wealthCtx.strokeStyle=col; wealthCtx.lineWidth=1; wealthCtx.setLineDash([3,3]);
    wealthCtx.beginPath(); wealthCtx.moveTo(x,WC.t); wealthCtx.lineTo(x,WC.t+WC.ph); wealthCtx.stroke();
    wealthCtx.setLineDash([]);
    wealthCtx.fillStyle=col; wealthCtx.font='8.5px Spectral,serif'; wealthCtx.textAlign='left';
    wealthCtx.fillText(label, x+3, WC.t+WC.ph-6);
  });

  // Sampled dots (recent)
  ['A','B'].forEach(key => {
    const s = state.sets[key];
    s.samples.slice(-60).forEach((sp,i) => {
      const alpha = (i/60)*0.5+0.1;
      wealthCtx.beginPath();
      wealthCtx.arc(wCx(sp.wealthLog), WC.t+WC.ph*0.5+randNormal()*WC.ph*0.1, 2.5, 0, 2*Math.PI);
      const rgb = key==='A' ? `139,58,30` : `26,92,138`;
      wealthCtx.fillStyle = `rgba(${rgb},${alpha.toFixed(2)})`;
      wealthCtx.fill();
    });
  });
}

/* ================================================================
   OUTCOME CANVAS
   ================================================================ */
const outcomeCanvas = document.getElementById('sim-outcome-canvas');
const outcomeCtx    = outcomeCanvas.getContext('2d');
const OC = { W: 1000, H: 280, l: 70, t: 28, r: 20, b: 50 };
OC.pw = OC.W - OC.l - OC.r;
OC.ph = OC.H - OC.t - OC.b;

// Histogram bins: log-income from log10($15k) to log10($2M), 50 bins
const LOG_INC_MIN = Math.log10(15000), LOG_INC_MAX = Math.log10(2000000);
const N_BINS = 50;
function incToBin(inc) {
  const logI = Math.log10(Math.max(100, inc));
  return Math.floor((logI - LOG_INC_MIN) / (LOG_INC_MAX - LOG_INC_MIN) * N_BINS);
}
function binToX(b) { return OC.l + (b + 0.5) / N_BINS * OC.pw; }
function binToDollars(b) { return Math.pow(10, LOG_INC_MIN + (b+0.5)/N_BINS*(LOG_INC_MAX-LOG_INC_MIN)); }

function drawOutcomePanel() {
  const sA = state.sets.A.samples;
  const sB = state.sets.B.samples;

  outcomeCtx.clearRect(0, 0, OC.W, OC.H);
  outcomeCtx.fillStyle = '#fafaf8';
  outcomeCtx.fillRect(0, 0, OC.W, OC.H);

  if (sA.length === 0 && sB.length === 0) {
    outcomeCtx.fillStyle = '#aab'; outcomeCtx.font = 'italic 14px Spectral,serif';
    outcomeCtx.textAlign = 'center';
    outcomeCtx.fillText('Select regions in the panels above, then click ▶ Sample', OC.W/2, OC.H/2);
    return;
  }

  // Build histograms
  const histA = new Array(N_BINS).fill(0);
  const histB = new Array(N_BINS).fill(0);
  sA.forEach(sp => { const b = incToBin(sp.hhIncome); if (b>=0&&b<N_BINS) histA[b]++; });
  sB.forEach(sp => { const b = incToBin(sp.hhIncome); if (b>=0&&b<N_BINS) histB[b]++; });
  const maxCount = Math.max(1, ...histA, ...histB);

  // Background grid
  for (let i=0; i<=4; i++) {
    const y = OC.t + OC.ph - i/4*OC.ph;
    outcomeCtx.strokeStyle = '#e8e8e4'; outcomeCtx.lineWidth = 0.5;
    outcomeCtx.beginPath(); outcomeCtx.moveTo(OC.l, y); outcomeCtx.lineTo(OC.l+OC.pw, y); outcomeCtx.stroke();
  }

  // Reference lines: median US household income ($74k) and $200k
  const refs = [
    {inc:74580, label:'US median\n$74k', col:'rgba(100,100,100,0.5)'},
    {inc:200000, label:'$200k', col:'rgba(100,100,100,0.35)'},
  ];
  refs.forEach(({inc,label,col}) => {
    const logI = Math.log10(inc);
    const x = OC.l + (logI-LOG_INC_MIN)/(LOG_INC_MAX-LOG_INC_MIN)*OC.pw;
    outcomeCtx.strokeStyle=col; outcomeCtx.lineWidth=1; outcomeCtx.setLineDash([4,3]);
    outcomeCtx.beginPath(); outcomeCtx.moveTo(x,OC.t); outcomeCtx.lineTo(x,OC.t+OC.ph); outcomeCtx.stroke();
    outcomeCtx.setLineDash([]);
    outcomeCtx.fillStyle=col; outcomeCtx.font='8px Spectral,serif'; outcomeCtx.textAlign='center';
    label.split('\n').forEach((ln,i) => outcomeCtx.fillText(ln, x, OC.t+OC.ph-8-i*11));
  });

  const bw = OC.pw / N_BINS;

  // Draw bars: Set B first (behind)
  if (sB.length > 0) {
    histB.forEach((count, b) => {
      const barH = (count / maxCount) * OC.ph;
      outcomeCtx.fillStyle = 'rgba(26,92,138,0.5)';
      outcomeCtx.fillRect(OC.l + b*bw, OC.t+OC.ph-barH, bw-1, barH);
    });
  }
  // Set A on top
  if (sA.length > 0) {
    histA.forEach((count, b) => {
      const barH = (count / maxCount) * OC.ph;
      outcomeCtx.fillStyle = 'rgba(139,58,30,0.55)';
      outcomeCtx.fillRect(OC.l + b*bw, OC.t+OC.ph-barH, bw-1, barH);
    });
  }

  // Median lines
  function medianIncome(samples) {
    if (!samples.length) return 0;
    const sorted = [...samples.map(s=>s.hhIncome)].sort((a,b)=>a-b);
    return sorted[Math.floor(sorted.length/2)];
  }
  function percIncome(samples, pct) {
    if (!samples.length) return 0;
    const sorted = [...samples.map(s=>s.hhIncome)].sort((a,b)=>a-b);
    return sorted[Math.floor(sorted.length*pct)];
  }

  [[sA,'A','#8b3a1e'],[sB,'B','#1a5c8a']].forEach(([samples, key, col]) => {
    if (!samples.length) return;
    const med = medianIncome(samples);
    const logI = Math.log10(med);
    const x = OC.l + (logI-LOG_INC_MIN)/(LOG_INC_MAX-LOG_INC_MIN)*OC.pw;
    outcomeCtx.strokeStyle=col; outcomeCtx.lineWidth=2.5; outcomeCtx.setLineDash([]);
    outcomeCtx.beginPath(); outcomeCtx.moveTo(x,OC.t); outcomeCtx.lineTo(x,OC.t+OC.ph); outcomeCtx.stroke();
    outcomeCtx.fillStyle=col; outcomeCtx.font='bold 10px Lato,sans-serif'; outcomeCtx.textAlign='center';
    outcomeCtx.fillRect(x-28, OC.t-1, 56, 16);
    outcomeCtx.fillStyle='white';
    outcomeCtx.fillText('Median '+key+': '+formatDollars(med), x, OC.t+11);
    // Update stats
    if (key==='A') {
      document.getElementById('sim-stat-a-med').textContent = formatDollars(med);
      document.getElementById('sim-stat-a-iqr').textContent = formatDollars(percIncome(samples,0.25))+'–'+formatDollars(percIncome(samples,0.75));
      document.getElementById('sim-stat-a-p90').textContent = formatDollars(percIncome(samples,0.90));
    } else {
      document.getElementById('sim-stat-b-med').textContent = formatDollars(med);
      document.getElementById('sim-stat-b-iqr').textContent = formatDollars(percIncome(samples,0.25))+'–'+formatDollars(percIncome(samples,0.75));
      document.getElementById('sim-stat-b-p90').textContent = formatDollars(percIncome(samples,0.90));
    }
  });

  if (sA.length && sB.length) {
    const medA = medianIncome(sA), medB = medianIncome(sB);
    const pct = (sA.filter(s => {
      const r = Math.random(); return s.hhIncome > sB[Math.floor(r * sB.length)]?.hhIncome;
    }).length / Math.min(sA.length, 200) * 100).toFixed(0);
    document.getElementById('sim-stat-diff').textContent = (medA > medB ? 'A > B: ' : 'B > A: ') +
      Math.round(Math.abs(medA-medB)/Math.min(medA,medB)*100) + '% higher median';
  }

  // X-axis ticks and labels
  outcomeCtx.strokeStyle = '#aab'; outcomeCtx.lineWidth = 0.8;
  outcomeCtx.beginPath(); outcomeCtx.moveTo(OC.l, OC.t+OC.ph); outcomeCtx.lineTo(OC.l+OC.pw, OC.t+OC.ph); outcomeCtx.stroke();
  const tickIncs = [20000, 50000, 100000, 200000, 500000, 1000000];
  tickIncs.forEach(inc => {
    const logI = Math.log10(inc);
    if (logI < LOG_INC_MIN || logI > LOG_INC_MAX) return;
    const x = OC.l + (logI-LOG_INC_MIN)/(LOG_INC_MAX-LOG_INC_MIN)*OC.pw;
    outcomeCtx.strokeStyle='#aab'; outcomeCtx.lineWidth=0.8;
    outcomeCtx.beginPath(); outcomeCtx.moveTo(x, OC.t+OC.ph); outcomeCtx.lineTo(x, OC.t+OC.ph+5); outcomeCtx.stroke();
    outcomeCtx.fillStyle='#7a8a'; outcomeCtx.font='10px Spectral,serif'; outcomeCtx.textAlign='center';
    outcomeCtx.fillText(formatDollars(inc), x, OC.t+OC.ph+17);
  });
  outcomeCtx.fillStyle='#556'; outcomeCtx.font='italic 12px Lato,sans-serif'; outcomeCtx.textAlign='center';
  const genLabel = state.gen === 0 ? 'Household Income (this generation)' : 'Child Household Income (next generation, with inheritance)';
  outcomeCtx.fillText(genLabel, OC.l+OC.pw/2, OC.H-4);

  // Legend
  [[sA.length,'A','rgba(139,58,30,0.55)'],[sB.length,'B','rgba(26,92,138,0.5)']].forEach(([n,key,col],i) => {
    const lx = OC.l + 8 + i*130;
    outcomeCtx.fillStyle=col; outcomeCtx.fillRect(lx, OC.t+4, 14, 11);
    outcomeCtx.fillStyle='#444'; outcomeCtx.font='10px Lato'; outcomeCtx.textAlign='left';
    outcomeCtx.fillText(`Set ${key} (n=${n})`, lx+18, OC.t+13);
  });
}

/* ================================================================
   SAMPLING ENGINE
   ================================================================ */
function sampleFromSet(key) {
  const s = state.sets[key];
  const r = s.traitRect;

  // Rejection-sample from bivariate normal within rectangle
  let iqZ, conscZ, tries = 0;
  do {
    iqZ    = randNormal();
    conscZ = iqZ * RHO_TRAITS + randNormal() * Math.sqrt(1 - RHO_TRAITS*RHO_TRAITS);
    tries++;
    if (tries > 500) {
      iqZ    = r.x0 + Math.random()*(r.x1-r.x0);
      conscZ = r.y0 + Math.random()*(r.y1-r.y0);
      break;
    }
  } while (iqZ < r.x0 || iqZ > r.x1 || conscZ < r.y0 || conscZ > r.y1);

  // Sample wealth percentile from bracket
  const wPct = s.wealthRange.lo + Math.random()*(s.wealthRange.hi - s.wealthRange.lo);
  const wealthLog = log10FromPctile(wPct);

  let hhIncome;
  if (state.gen === 0) {
    // THIS GENERATION: household = person + partner
    const personIncome = computeIndividualIncome(iqZ, conscZ, wealthLog);
    const partner = computePartner(iqZ, conscZ, wealthLog, state.am);
    const partnerIncome = computeIndividualIncome(partner.iqZ, partner.conscZ, partner.wealthLog);
    hhIncome = personIncome + partnerIncome;
    return { iqZ, conscZ, wealthLog, hhIncome, gen: 0 };
  } else {
    // NEXT GENERATION
    const personIncome = computeIndividualIncome(iqZ, conscZ, wealthLog);
    const partner = computePartner(iqZ, conscZ, wealthLog, state.am);
    const partnerIncome = computeIndividualIncome(partner.iqZ, partner.conscZ, partner.wealthLog);
    const hhIncomeParent = personIncome + partnerIncome;
    const child = computeChildGen(iqZ, conscZ, wealthLog, partner.iqZ, partner.conscZ, partner.wealthLog, hhIncomeParent);
    // Child's household income
    const childPartner = computePartner(child.iqZ, child.conscZ, child.wealthLog, state.am);
    const childIncome = computeIndividualIncome(child.iqZ, child.conscZ, child.wealthLog);
    const childPartnerIncome = computeIndividualIncome(childPartner.iqZ, childPartner.conscZ, childPartner.wealthLog);
    hhIncome = childIncome + childPartnerIncome;
    return { iqZ: child.iqZ, conscZ: child.conscZ, wealthLog: child.wealthLog, hhIncome, gen: 1 };
  }
}

let animFrame = null;
function animationTick() {
  if (!state.animating) return;
  const key = state.animTarget;
  const s = state.sets[key];
  for (let i = 0; i < ANIM_RATE; i++) {
    if (s.samples.length >= N_SAMPLES) { state.animating = false; break; }
    s.samples.push(sampleFromSet(key));
  }
  drawTraitPanel();
  drawWealthPanel();
  drawOutcomePanel();
  if (state.animating) animFrame = requestAnimationFrame(animationTick);
}

function startSampling() {
  if (state.animating) return;
  const key = state.active;
  state.sets[key].samples = [];
  state.animating = true;
  state.animTarget = key;
  cancelAnimationFrame(animFrame);
  animFrame = requestAnimationFrame(animationTick);
}

function clearSamples() {
  cancelAnimationFrame(animFrame);
  state.animating = false;
  state.sets.A.samples = [];
  state.sets.B.samples = [];
  ['a','b'].forEach(k => {
    ['med','iqr','p90'].forEach(m => { document.getElementById(`sim-stat-${k}-${m}`).textContent = '-'; });
  });
  document.getElementById('sim-stat-diff').textContent = '-';
  drawTraitPanel();
  drawWealthPanel();
  drawOutcomePanel();
}

/* ================================================================
   CONTROLS
   ================================================================ */
function setActive(key) {
  state.active = key;
  const tA = document.getElementById('sim-tab-A');
  const tB = document.getElementById('sim-tab-B');
  tA.style.background = key==='A' ? '#8b3a1e' : 'white';
  tA.style.color       = key==='A' ? 'white'   : '#8b3a1e';
  tB.style.background  = key==='B' ? '#1a5c8a' : 'white';
  tB.style.color       = key==='B' ? 'white'   : '#1a5c8a';
  drawTraitPanel();
  drawWealthPanel();
}

function onAMChange(val) {
  state.am = val / 100;
  document.getElementById('sim-am-val').textContent = state.am.toFixed(2);
}

function setGen(g) {
  state.gen = g;
  const g0 = document.getElementById('sim-gen0');
  const g1 = document.getElementById('sim-gen1');
  g0.style.background = g===0 ? '#1a1d1e' : 'white';
  g0.style.color       = g===0 ? 'white'   : '#6f777d';
  g1.style.background  = g===1 ? '#1a1d1e' : 'white';
  g1.style.color       = g===1 ? 'white'   : '#6f777d';
  clearSamples();
}

const PRESETS = {
  'iq-vs-wealth': {
    title: 'IQ vs Wealth - same expected income, different paths',
    A: { traitRect: {x0:1.0, y0:0.5, x1:2.5, y1:2.0}, wealthRange: {lo:0.40, hi:0.60} },
    B: { traitRect: {x0:-0.3, y0:-0.3, x1:0.8, y1:0.8}, wealthRange: {lo:0.80, hi:0.95} },
  },
  'dynasty': {
    title: 'Dynasty - top traits + bottom wealth vs average traits + top wealth',
    A: { traitRect: {x0:1.3, y0:1.0, x1:3.0, y1:3.0}, wealthRange: {lo:0.10, hi:0.30} },
    B: { traitRect: {x0:-0.5, y0:-0.5, x1:0.5, y1:0.5}, wealthRange: {lo:0.94, hi:0.99} },
  },
  'floor': {
    title: 'The Floor - identical traits, debt vs comfortable middle class',
    A: { traitRect: {x0:-0.3, y0:-0.3, x1:0.3, y1:0.3}, wealthRange: {lo:0.01, hi:0.15} },
    B: { traitRect: {x0:-0.3, y0:-0.3, x1:0.3, y1:0.3}, wealthRange: {lo:0.45, hi:0.60} },
  },
};

function loadPreset(key) {
  const p = PRESETS[key];
  state.sets.A.traitRect  = {...p.A.traitRect};
  state.sets.A.wealthRange = {...p.A.wealthRange};
  state.sets.B.traitRect  = {...p.B.traitRect};
  state.sets.B.wealthRange = {...p.B.wealthRange};
  clearSamples();
  const titleEl = document.getElementById('sim-outcome-title');
  if (titleEl) titleEl.textContent = p.title;
}

/* ================================================================
   CANVAS INTERACTION - TRAIT PANEL
   ================================================================ */
let traitDrag = null;
function traitCanvasCoords(e) {
  const rect = traitCanvas.getBoundingClientRect();
  const scaleX = TC.W / rect.width, scaleY = TC.H / rect.height;
  return [
    tInvX((e.clientX - rect.left) * scaleX),
    tInvY((e.clientY - rect.top)  * scaleY),
  ];
}
traitCanvas.addEventListener('mousedown', e => {
  const [x,y] = traitCanvasCoords(e);
  traitDrag = {x0:x, y0:y};
});
traitCanvas.addEventListener('mousemove', e => {
  if (!traitDrag) return;
  const [x,y] = traitCanvasCoords(e);
  const s = state.sets[state.active];
  s.traitRect = {
    x0: Math.min(traitDrag.x0, x), y0: Math.min(traitDrag.y0, y),
    x1: Math.max(traitDrag.x0, x), y1: Math.max(traitDrag.y0, y),
  };
  drawTraitPanel();
});
traitCanvas.addEventListener('mouseup', () => { traitDrag = null; });
traitCanvas.addEventListener('mouseleave', () => { traitDrag = null; });

// Touch
traitCanvas.addEventListener('touchstart', e => { e.preventDefault(); const t=e.touches[0]; traitDrag={...traitCanvasCoords(t).reduce((o,v,i)=>({...o,[['x0','y0'][i]]:v}),{})}; traitDrag = {x0: traitCanvasCoords(e.touches[0])[0], y0: traitCanvasCoords(e.touches[0])[1]}; }, {passive:false});
traitCanvas.addEventListener('touchmove', e => { e.preventDefault(); if(!traitDrag)return; const[x,y]=traitCanvasCoords(e.touches[0]); const s=state.sets[state.active]; s.traitRect={x0:Math.min(traitDrag.x0,x),y0:Math.min(traitDrag.y0,y),x1:Math.max(traitDrag.x0,x),y1:Math.max(traitDrag.y0,y)}; drawTraitPanel(); }, {passive:false});
traitCanvas.addEventListener('touchend', () => { traitDrag = null; });

/* ================================================================
   CANVAS INTERACTION - WEALTH PANEL
   ================================================================ */
let wealthDrag = null;
function wealthCanvasX(e) {
  const rect = wealthCanvas.getBoundingClientRect();
  return wInvX((e.clientX - rect.left) * WC.W / rect.width);
}
wealthCanvas.addEventListener('mousedown', e => {
  const lw = wealthCanvasX(e);
  const s = state.sets[state.active];
  const pct = pctileFromLog10(lw);
  // Check if near left or right handle to decide which side to drag
  const dLeft  = Math.abs(pct - s.wealthRange.lo);
  const dRight = Math.abs(pct - s.wealthRange.hi);
  wealthDrag = dLeft < dRight ? 'lo' : 'hi';
});
wealthCanvas.addEventListener('mousemove', e => {
  if (!wealthDrag) return;
  const lw  = wealthCanvasX(e);
  const pct = Math.max(0.01, Math.min(0.99, pctileFromLog10(lw)));
  const s   = state.sets[state.active];
  if (wealthDrag === 'lo') s.wealthRange.lo = Math.min(pct, s.wealthRange.hi - 0.02);
  else                      s.wealthRange.hi = Math.max(pct, s.wealthRange.lo + 0.02);
  drawWealthPanel();
});
wealthCanvas.addEventListener('mouseup', () => { wealthDrag = null; });
wealthCanvas.addEventListener('mouseleave', () => { wealthDrag = null; });

// Touch
wealthCanvas.addEventListener('touchstart', e => { e.preventDefault(); const lw=wealthCanvasX(e.touches[0]); const pct=pctileFromLog10(lw); const s=state.sets[state.active]; wealthDrag=Math.abs(pct-s.wealthRange.lo)<Math.abs(pct-s.wealthRange.hi)?'lo':'hi'; }, {passive:false});
wealthCanvas.addEventListener('touchmove', e => { e.preventDefault(); if(!wealthDrag)return; const lw=wealthCanvasX(e.touches[0]); const pct=Math.max(0.01,Math.min(0.99,pctileFromLog10(lw))); const s=state.sets[state.active]; if(wealthDrag==='lo')s.wealthRange.lo=Math.min(pct,s.wealthRange.hi-0.02); else s.wealthRange.hi=Math.max(pct,s.wealthRange.lo+0.02); drawWealthPanel(); }, {passive:false});
wealthCanvas.addEventListener('touchend', () => { wealthDrag = null; });

/* ================================================================
   INIT
   ================================================================ */
buildTraitCache();
buildWealthDensity();
drawTraitPanel();
drawWealthPanel();
drawOutcomePanel();
loadPreset('iq-vs-wealth');

/* Wire all controls via addEventListener - no global scope needed */
document.getElementById('sim-tab-A').addEventListener('click', () => setActive('A'));
document.getElementById('sim-tab-B').addEventListener('click', () => setActive('B'));
document.getElementById('sim-sample-btn').addEventListener('click', startSampling);
document.getElementById('sim-clear-btn').addEventListener('click', clearSamples);
document.getElementById('sim-preset-iq').addEventListener('click', () => loadPreset('iq-vs-wealth'));
document.getElementById('sim-preset-dynasty').addEventListener('click', () => loadPreset('dynasty'));
document.getElementById('sim-preset-floor').addEventListener('click', () => loadPreset('floor'));
document.getElementById('sim-am').addEventListener('input', e => onAMChange(e.target.value));
document.getElementById('sim-biq').addEventListener('input', e => onBIQChange(e.target.value));
document.getElementById('sim-gen0').addEventListener('click', () => setGen(0));
document.getElementById('sim-gen1').addEventListener('click', () => setGen(1));
})();


/* ============================================================
   FIGURE 7 - FAMILY DYNASTY SIMULATOR
   ============================================================ */
(function() {
'use strict';

/* ================================================================
   CONSTANTS & MODEL
   ================================================================ */
let   F7_B_IQ    = 0.35;
const F7_B_CONSC  = 0.25;
const F7_B_WEALTH = 0.45;
const F7_RESID_SD = 0.70;
const F7_RHO      = 0.25;
const F7_H2_IQ    = 0.60;
const F7_H2_CONSC = 0.45;
const F7_INC_MED  = 40000;
const F7_WEALTH_ACCUM = 20000;   // below: no compounding
const F7_WEALTH_DEBT  = 1000;    // below: debt erosion
const F7_IQ_SAVINGS   = 0.04;   // each SD IQ above mean → +4pp savings rate
const F7_INC_SD   = 0.90;
const F7_W_MEAN   = 5.20;
const F7_W_SD     = 1.05;
const F7_WT = [
  [0.00,1.0],[0.11,2.0],[0.20,3.70],[0.30,4.45],[0.40,4.92],
  [0.50,5.29],[0.60,5.53],[0.70,5.77],[0.80,6.00],
  [0.90,6.40],[0.95,6.71],[0.99,7.04],[1.00,7.70]
];
// Generation colour ramp: founders handled separately; gens 1-5 orange → dark grey
const F7_GCOLS = ['#607080','#e07530','#c07a38','#8a7048','#606060','#383838'];

/* ================================================================
   MATH UTILITIES
   ================================================================ */
let _f7spare = null;
function f7rn() {
  if (_f7spare !== null) { const v=_f7spare; _f7spare=null; return v; }
  let u,v,s;
  do { u=Math.random()*2-1; v=Math.random()*2-1; s=u*u+v*v; } while(s>=1||s===0);
  const m=Math.sqrt(-2*Math.log(s)/s); _f7spare=v*m; return u*m;
}
function f7wL(p) {
  p=Math.max(0.001,Math.min(0.999,p));
  for (let i=1;i<F7_WT.length;i++) {
    if (p<=F7_WT[i][0]) { const t=(p-F7_WT[i-1][0])/(F7_WT[i][0]-F7_WT[i-1][0]); return F7_WT[i-1][1]+t*(F7_WT[i][1]-F7_WT[i-1][1]); }
  }
  return F7_WT[F7_WT.length-1][1];
}
function f7wP(lw) {
  lw=Math.max(F7_WT[0][1],Math.min(F7_WT[F7_WT.length-1][1],lw));
  for (let i=1;i<F7_WT.length;i++) {
    if (lw<=F7_WT[i][1]) { const t=(lw-F7_WT[i-1][1])/(F7_WT[i][1]-F7_WT[i-1][1]); return F7_WT[i-1][0]+t*(F7_WT[i][0]-F7_WT[i-1][0]); }
  }
  return 1.0;
}
function f7wZ(lw) { return (lw-F7_W_MEAN)/F7_W_SD; }
function f7fmt(d) {
  if (d>=1e6) return '$'+(d/1e6).toFixed(1)+'M';
  if (d>=1e3) return '$'+Math.round(d/1000)+'k';
  return '$'+Math.round(d);
}
function f7hex2rgb(h) {
  return parseInt(h.slice(1,3),16)+','+parseInt(h.slice(3,5),16)+','+parseInt(h.slice(5,7),16);
}

/* ================================================================
   INCOME & REPRODUCTION MODEL
   ================================================================ */
function f7inc(iqZ,conscZ,wLog) {
  // Expected income (no residual noise) - variance comes from trait inheritance, not income noise
  return F7_INC_MED*Math.exp((F7_B_IQ*iqZ+F7_B_CONSC*conscZ+F7_B_WEALTH*f7wZ(wLog))*F7_INC_SD);
}
function f7part(iqZ,conscZ,wLog,am) {
  const sq=Math.sqrt(Math.max(0,1-am*am));
  return { iqZ:am*iqZ+sq*f7rn(), conscZ:am*conscZ+sq*f7rn(), wealthLog:F7_W_MEAN+(am*f7wZ(wLog)+sq*f7rn())*F7_W_SD };
}
function f7childOf(p1,p2,hhInc) {
  const mIQ=(p1.iqZ+p2.iqZ)/2, mC=(p1.conscZ+p2.conscZ)/2;
  const cIQ   =mIQ *Math.sqrt(F7_H2_IQ)   +f7rn()*Math.sqrt(1-F7_H2_IQ/2);
  const cConsc=mC  *Math.sqrt(F7_H2_CONSC)+f7rn()*Math.sqrt(1-F7_H2_CONSC/2);
  // Wealth: threshold-gated compounding + IQ-adjusted savings
  // Dynasty heir inherits primarily from dynasty lineage (p1), minority from partner (p2)
  const avgW = Math.pow(10,p1.wealthLog)*0.75 + Math.pow(10,p2.wealthLog)*0.25;
  const avgIQ = p1.iqZ*0.75 + p2.iqZ*0.25;

  // Capital growth is threshold-gated
  const wGrow = avgW < F7_WEALTH_DEBT  ? 0.85
              : avgW < F7_WEALTH_ACCUM ? 1.0
              :                          1.5;

  // Savings rate is IQ-adjusted but only activates above accumulation threshold
  const sRate = avgW >= F7_WEALTH_ACCUM
    ? Math.max(0, 0.12 + F7_IQ_SAVINGS * avgIQ)
    : 0;

  const childW = 0.85 * avgW * wGrow + 0.15 * hhInc * 40 * sRate;
  return { iqZ:cIQ, conscZ:cConsc, wealthLog:Math.log10(Math.max(100,childW)) };
}

/* ================================================================
   STATE
   ================================================================ */
const f7={
  active:'A',
  founders:{ A:{iqZ:1.2,conscZ:0.8,wealthLog:5.8}, B:{iqZ:-0.2,conscZ:-0.1,wealthLog:6.2} },
  am:0.70, kids:2,
  generations:[], simDone:false,
  displayedGens:0, animating:false
};

/* ================================================================
   TRAIT CANVAS
   ================================================================ */
const f7TC=document.getElementById('f7-trait-canvas');
const f7tC=f7TC.getContext('2d');
const FT={W:500,H:380,l:55,t:20,r:20,b:45};
FT.pw=FT.W-FT.l-FT.r; FT.ph=FT.H-FT.t-FT.b;
const FT_ZMIN=-3.5, FT_ZMAX=3.5;
const f7tX=z=>FT.l+(z-FT_ZMIN)/(FT_ZMAX-FT_ZMIN)*FT.pw;
const f7tY=z=>FT.t+(1-(z-FT_ZMIN)/(FT_ZMAX-FT_ZMIN))*FT.ph;
const f7tInvX=px=>FT_ZMIN+(px-FT.l)/FT.pw*(FT_ZMAX-FT_ZMIN);
const f7tInvY=py=>FT_ZMAX-(py-FT.t)/FT.ph*(FT_ZMAX-FT_ZMIN);

let f7TCache=null;
function f7buildTCache() {
  const img=f7tC.createImageData(FT.W,FT.H); const d=img.data;
  const rho=F7_RHO, denom=2*(1-rho*rho);
  for (let py=0;py<FT.H;py++) for (let px=0;px<FT.W;px++) {
    const idx=(py*FT.W+px)*4;
    if (px<FT.l||px>FT.l+FT.pw||py<FT.t||py>FT.t+FT.ph) { d[idx]=250;d[idx+1]=250;d[idx+2]=250;d[idx+3]=255; continue; }
    const x=f7tInvX(px),y=f7tInvY(py);
    const q=(x*x-2*rho*x*y+y*y)/denom;
    const maxQ=0; // PDF at origin = 1/(2π√(1-ρ²))
    const pdf=Math.exp(-q); // unnormalised
    const t=Math.pow(pdf, 0.45);
    d[idx]=Math.round(235+(90-235)*t); d[idx+1]=Math.round(240+(165-240)*t);
    d[idx+2]=Math.round(250+(220-250)*t); d[idx+3]=255;
  }
  f7TCache=img;
}

function f7drawTrait() {
  if (!f7TCache) f7buildTCache();
  f7tC.putImageData(f7TCache,0,0);
  // Grid
  f7tC.strokeStyle='#cce'; f7tC.lineWidth=0.4;
  for (let v=-3;v<=3;v++) { if(v===0)continue; const cx=f7tX(v),cy=f7tY(v);
    f7tC.beginPath();f7tC.moveTo(cx,FT.t);f7tC.lineTo(cx,FT.t+FT.ph);f7tC.stroke();
    f7tC.beginPath();f7tC.moveTo(FT.l,cy);f7tC.lineTo(FT.l+FT.pw,cy);f7tC.stroke(); }
  // Axes
  f7tC.strokeStyle='#aab'; f7tC.lineWidth=0.8;
  f7tC.beginPath();f7tC.moveTo(FT.l,FT.t);f7tC.lineTo(FT.l,FT.t+FT.ph);f7tC.stroke();
  f7tC.beginPath();f7tC.moveTo(FT.l,FT.t+FT.ph);f7tC.lineTo(FT.l+FT.pw,FT.t+FT.ph);f7tC.stroke();
  // Tick labels
  f7tC.fillStyle='#8a9'; f7tC.font='11px Spectral,serif'; f7tC.textAlign='center';
  for (let v=-3;v<=3;v++) { if(v===0)continue;
    f7tC.fillText(v+'σ',f7tX(v),FT.t+FT.ph+14);
    f7tC.textAlign='right'; f7tC.fillText(v+'σ',FT.l-5,f7tY(v)+4); f7tC.textAlign='center'; }
  f7tC.fillStyle='#556'; f7tC.font='italic 10px Spectral,serif';
  [-2,-1,0,1,2].forEach(v=>f7tC.fillText('IQ '+(100+v*15),f7tX(v),FT.t+FT.ph+26));
  f7tC.fillStyle='#556'; f7tC.font='italic 12px Lato,sans-serif'; f7tC.textAlign='center';
  f7tC.fillText('IQ (z-score)',FT.l+FT.pw/2,FT.H-3);
  f7tC.save(); f7tC.translate(13,FT.t+FT.ph/2); f7tC.rotate(-Math.PI/2);
  f7tC.fillText('Conscientiousness',0,0); f7tC.restore();
  // Descendant dots (gens 1-5, max 60 per gen, smaller radius)
  for (let g=1;g<=5&&g<f7.generations.length&&g<f7.displayedGens;g++) {
    const gen=f7.generations[g]; const col=F7_GCOLS[g];
    const step=gen.length>60?Math.ceil(gen.length/60):1;
    gen.forEach((p,i)=>{ if(i%step!==0)return;
      const x=f7tX(p.iqZ),y=f7tY(p.conscZ);
      if(x<FT.l||x>FT.l+FT.pw||y<FT.t||y>FT.t+FT.ph)return;
      f7tC.beginPath(); f7tC.arc(x,y,3,0,2*Math.PI);
      f7tC.fillStyle='rgba('+f7hex2rgb(col)+',0.7)'; f7tC.fill(); });
  }
  // Founders on top
  [['A','#8b3a1e'],['B','#1a5c8a']].forEach(([key,col])=>{
    const p=f7.founders[key]; const x=f7tX(p.iqZ),y=f7tY(p.conscZ);
    f7tC.beginPath(); f7tC.arc(x,y,9,0,2*Math.PI);
    f7tC.fillStyle=col; f7tC.fill();
    f7tC.strokeStyle=f7.active===key?'white':'rgba(255,255,255,0.5)';
    f7tC.lineWidth=2; f7tC.stroke();
    f7tC.fillStyle='white'; f7tC.font='bold 10px Lato,sans-serif'; f7tC.textAlign='center';
    f7tC.fillText(key,x,y+4); });
  // Legend
  const litems=f7.simDone
    ? [['A','#8b3a1e'],['B','#1a5c8a'],...GEN_LABELS.slice(1,f7.displayedGens).map((lbl,i)=>[lbl,GEN_ROW_COLS[i+1]])]
    : [['Founder A','#8b3a1e'],['Founder B','#1a5c8a']];
  const lx=FT.l+4, ly=FT.t+4;
  f7tC.fillStyle='rgba(255,255,255,0.88)'; f7tC.fillRect(lx,ly,82,litems.length*14+6);
  litems.forEach(([lbl,col],i)=>{
    const y=ly+6+i*14;
    f7tC.fillStyle=col; f7tC.beginPath(); f7tC.arc(lx+6,y+4,4,0,2*Math.PI); f7tC.fill();
    f7tC.fillStyle='#333'; f7tC.font='9px Lato,sans-serif'; f7tC.textAlign='left';
    f7tC.fillText(lbl,lx+14,y+8); });
}

/* ================================================================
   WEALTH CANVAS
   ================================================================ */
const f7WC=document.getElementById('f7-wealth-canvas');
const f7wCtx=f7WC.getContext('2d');
const FW={W:500,H:380,l:55,t:20,r:20,b:45};
FW.pw=FW.W-FW.l-FW.r; FW.ph=FW.H-FW.t-FW.b;
const FW_LMIN=1.5, FW_LMAX=7.8;
const f7wX=lw=>FW.l+(lw-FW_LMIN)/(FW_LMAX-FW_LMIN)*FW.pw;
const f7wInvX=px=>FW_LMIN+(px-FW.l)/FW.pw*(FW_LMAX-FW_LMIN);

let f7WDens=null;
function f7buildWDens() {
  const N=300,pts=[]; let maxD=0;
  for (let i=0;i<=N;i++) {
    const lw=FW_LMIN+(FW_LMAX-FW_LMIN)*i/N;
    const d=(f7wP(lw+0.06)-f7wP(lw-0.06))/0.12;
    pts.push([lw,d]); if(d>maxD)maxD=d;
  }
  f7WDens={pts,maxD};
}

function f7drawWealth() {
  if (!f7WDens) f7buildWDens();
  const {pts,maxD}=f7WDens;
  f7wCtx.clearRect(0,0,FW.W,FW.H); f7wCtx.fillStyle='#f9f9f8'; f7wCtx.fillRect(0,0,FW.W,FW.H);
  // Grid
  for (let e=2;e<=7;e++) { const x=f7wX(e);
    f7wCtx.strokeStyle='#e0e8e0'; f7wCtx.lineWidth=0.5;
    f7wCtx.beginPath();f7wCtx.moveTo(x,FW.t);f7wCtx.lineTo(x,FW.t+FW.ph);f7wCtx.stroke(); }
  // Axes
  f7wCtx.strokeStyle='#aab'; f7wCtx.lineWidth=0.8;
  f7wCtx.beginPath();f7wCtx.moveTo(FW.l,FW.t);f7wCtx.lineTo(FW.l,FW.t+FW.ph);f7wCtx.stroke();
  f7wCtx.beginPath();f7wCtx.moveTo(FW.l,FW.t+FW.ph);f7wCtx.lineTo(FW.l+FW.pw,FW.t+FW.ph);f7wCtx.stroke();
  // Density fill
  f7wCtx.beginPath(); f7wCtx.moveTo(f7wX(FW_LMIN),FW.t+FW.ph);
  pts.forEach(([lw,d])=>f7wCtx.lineTo(f7wX(lw),FW.t+FW.ph-(d/maxD)*FW.ph*0.88));
  f7wCtx.lineTo(f7wX(FW_LMAX),FW.t+FW.ph); f7wCtx.closePath();
  f7wCtx.fillStyle='rgba(100,140,100,0.12)'; f7wCtx.fill();
  f7wCtx.strokeStyle='#5a8a5a'; f7wCtx.lineWidth=1.5;
  f7wCtx.beginPath();
  pts.forEach(([lw,d],i)=>{ const px=f7wX(lw),py=FW.t+FW.ph-(d/maxD)*FW.ph*0.88; i===0?f7wCtx.moveTo(px,py):f7wCtx.lineTo(px,py); });
  f7wCtx.stroke();
  // Descendant ticks (gens 1-5)
  for (let g=1;g<=5&&g<f7.generations.length&&g<f7.displayedGens;g++) {
    const gen=f7.generations[g]; const col=F7_GCOLS[g];
    const step=gen.length>60?Math.ceil(gen.length/60):1;
    const midY=FW.t+FW.ph/2;
    gen.forEach((p,i)=>{ if(i%step!==0)return;
      const x=f7wX(p.wealthLog);
      f7wCtx.strokeStyle='rgba('+f7hex2rgb(col)+',0.6)'; f7wCtx.lineWidth=1.5;
      f7wCtx.beginPath(); f7wCtx.moveTo(x,midY-10+(i%5)*4); f7wCtx.lineTo(x,midY+10+(i%5)*4); f7wCtx.stroke(); }); }
  // X labels
  const xlbls={2:'$100',3:'$1k',4:'$10k',5:'$100k',6:'$1M',7:'$10M'};
  f7wCtx.fillStyle='#556'; f7wCtx.font='10px Spectral,serif'; f7wCtx.textAlign='center';
  for (let e=2;e<=7;e++) f7wCtx.fillText(xlbls[e],f7wX(e),FW.t+FW.ph+16);
  f7wCtx.fillStyle='#556'; f7wCtx.font='italic 12px Lato,sans-serif';
  f7wCtx.fillText('Starting Net Worth (log scale)',FW.l+FW.pw/2,FW.H-3);
  // Reference lines
  [{v:5.29,label:'Median',col:'#888'},{v:Math.log10(1060000),label:'Mean',col:'#5a8'}].forEach(({v,label,col})=>{
    const x=f7wX(v); f7wCtx.strokeStyle=col; f7wCtx.lineWidth=1; f7wCtx.setLineDash([3,3]);
    f7wCtx.beginPath();f7wCtx.moveTo(x,FW.t);f7wCtx.lineTo(x,FW.t+FW.ph);f7wCtx.stroke();
    f7wCtx.setLineDash([]);
    f7wCtx.fillStyle=col; f7wCtx.font='8.5px Spectral,serif'; f7wCtx.textAlign='left';
    f7wCtx.fillText(label,x+3,FW.t+FW.ph-6); });
  // Founder tick marks
  [['A','#8b3a1e'],['B','#1a5c8a']].forEach(([key,col])=>{
    const p=f7.founders[key]; const x=f7wX(p.wealthLog);
    f7wCtx.strokeStyle=col; f7wCtx.lineWidth=f7.active===key?3:2;
    f7wCtx.beginPath(); f7wCtx.moveTo(x,FW.t+8); f7wCtx.lineTo(x,FW.t+FW.ph-8); f7wCtx.stroke();
    // Triangle handle
    f7wCtx.fillStyle=col; f7wCtx.beginPath();
    f7wCtx.moveTo(x-7,FW.t+8); f7wCtx.lineTo(x+7,FW.t+8); f7wCtx.lineTo(x,FW.t+20); f7wCtx.closePath(); f7wCtx.fill();
    f7wCtx.fillStyle='white'; f7wCtx.font='bold 9px Lato,sans-serif'; f7wCtx.textAlign='center';
    f7wCtx.fillText(key,x,FW.t+17);
    f7wCtx.fillStyle=col; f7wCtx.font='8px Spectral,serif';
    f7wCtx.fillText(f7fmt(Math.pow(10,p.wealthLog)),x,FW.t+FW.ph-12); });
}

/* ================================================================
   JOY-PLOT (RIDGELINE) CANVAS - INCOME
   ================================================================ */
const f7GC=document.getElementById('f7-gen-canvas');
const f7gCtx=f7GC.getContext('2d');
const FG={W:960,H:300,l:90,t:15,r:20,b:42};
FG.pw=FG.W-FG.l-FG.r; FG.ph=FG.H-FG.t-FG.b;
const FG_LMIN=Math.log10(15000), FG_LMAX=Math.log10(2000000);
const N_ROWS=6, ROW_H=FG.ph/N_ROWS;
const f7gX=inc=>FG.l+(Math.log10(Math.max(1,inc))-FG_LMIN)/(FG_LMAX-FG_LMIN)*FG.pw;
const GEN_LABELS=['Founders','Gen 1','Gen 2','Gen 3','Gen 4','Gen 5'];
const GEN_ROW_COLS=['#8b3a1e',...F7_GCOLS.slice(1)];

function f7kde(incomes,logX) {
  if (!incomes.length) return 0;
  const h=0.14; let d=0;
  incomes.forEach(inc=>{ const z=(logX-Math.log10(Math.max(1,inc)))/h; d+=Math.exp(-0.5*z*z); });
  return d/(incomes.length*h*Math.sqrt(2*Math.PI));
}

function f7drawJoy() {
  f7gCtx.clearRect(0,0,FG.W,FG.H);
  f7gCtx.fillStyle='#fafaf8'; f7gCtx.fillRect(0,0,FG.W,FG.H);
  if (!f7.simDone) {
    f7gCtx.fillStyle='#aab'; f7gCtx.font='italic 14px Spectral,serif'; f7gCtx.textAlign='center';
    f7gCtx.fillText('Click ▶ Simulate to project the family dynasty across five generations',FG.W/2,FG.H/2);
    return;
  }
  // Vertical reference lines
  [20000,50000,100000,200000,500000,1000000].forEach(inc=>{
    const x=f7gX(inc); if(x<FG.l||x>FG.l+FG.pw)return;
    f7gCtx.strokeStyle='rgba(180,180,180,0.35)'; f7gCtx.lineWidth=0.5; f7gCtx.setLineDash([3,3]);
    f7gCtx.beginPath();f7gCtx.moveTo(x,FG.t);f7gCtx.lineTo(x,FG.t+FG.ph);f7gCtx.stroke();
    f7gCtx.setLineDash([]); });
  // US median
  const medX=f7gX(74580);
  f7gCtx.strokeStyle='rgba(100,100,100,0.2)'; f7gCtx.lineWidth=1; f7gCtx.setLineDash([4,3]);
  f7gCtx.beginPath();f7gCtx.moveTo(medX,FG.t);f7gCtx.lineTo(medX,FG.t+FG.ph);f7gCtx.stroke();
  f7gCtx.setLineDash([]);
  f7gCtx.fillStyle='rgba(120,120,120,0.5)'; f7gCtx.font='8px Spectral,serif'; f7gCtx.textAlign='center';
  f7gCtx.fillText('US median',medX,FG.t+7);
  // Build KDE per generation
  const N_KDE=200;
  const kdeData=f7.generations.map(gen=>{
    const incomes=gen.map(p=>p.hhIncome).filter(v=>v>0);
    const pts=[]; let maxD=0;
    for (let i=0;i<=N_KDE;i++) {
      const logX=FG_LMIN+(FG_LMAX-FG_LMIN)*i/N_KDE;
      const d=f7kde(incomes,logX); pts.push(d); if(d>maxD)maxD=d; }
    return {pts,incomes,maxD};
  });
  // Draw rows
  for (let g=0;g<N_ROWS;g++) {
    const rowY=FG.t+g*ROW_H; const col=GEN_ROW_COLS[g];
    // Subtle alternating bg
    if(g%2===0){f7gCtx.fillStyle='rgba(0,0,0,0.018)';f7gCtx.fillRect(FG.l,rowY,FG.pw,ROW_H);}
    // Row label
    f7gCtx.fillStyle=col; f7gCtx.font='bold 10px Lato,sans-serif'; f7gCtx.textAlign='right';
    f7gCtx.fillText(GEN_LABELS[g],FG.l-6,rowY+ROW_H/2+4);
    // Row separator
    f7gCtx.strokeStyle='rgba(180,180,180,0.3)'; f7gCtx.lineWidth=0.5;
    f7gCtx.beginPath();f7gCtx.moveTo(FG.l,rowY+ROW_H);f7gCtx.lineTo(FG.l+FG.pw,rowY+ROW_H);f7gCtx.stroke();
    if (g>=f7.generations.length||g>=f7.displayedGens) continue;
    const {pts,incomes,maxD}=kdeData[g]; if(!maxD) continue;
    const scaleH=ROW_H*0.88;
    // Filled area
    f7gCtx.beginPath(); f7gCtx.moveTo(FG.l,rowY+ROW_H);
    for (let i=0;i<=N_KDE;i++) {
      const x=FG.l+i/N_KDE*FG.pw; const y=rowY+ROW_H-(pts[i]/maxD)*scaleH; f7gCtx.lineTo(x,y); }
    f7gCtx.lineTo(FG.l+FG.pw,rowY+ROW_H); f7gCtx.closePath();
    f7gCtx.fillStyle='rgba('+f7hex2rgb(col)+',0.22)'; f7gCtx.fill();
    // Outline
    f7gCtx.beginPath();
    for (let i=0;i<=N_KDE;i++) {
      const x=FG.l+i/N_KDE*FG.pw; const y=rowY+ROW_H-(pts[i]/maxD)*scaleH;
      i===0?f7gCtx.moveTo(x,y):f7gCtx.lineTo(x,y); }
    f7gCtx.strokeStyle=col; f7gCtx.lineWidth=1.5; f7gCtx.stroke();
    // Median line
    const sorted=[...incomes].sort((a,b)=>a-b); const med=sorted[Math.floor(sorted.length/2)];
    const mx=f7gX(med);
    f7gCtx.strokeStyle=col; f7gCtx.lineWidth=2;
    f7gCtx.beginPath();f7gCtx.moveTo(mx,rowY+4);f7gCtx.lineTo(mx,rowY+ROW_H-2);f7gCtx.stroke();
    // Median label (keep in bounds)
    const lx=Math.min(Math.max(mx,FG.l+22),FG.l+FG.pw-22);
    f7gCtx.fillStyle=col; f7gCtx.font='bold 9px Lato,sans-serif'; f7gCtx.textAlign='center';
    f7gCtx.fillText(f7fmt(med),lx,rowY+11);
  }
  // X-axis
  f7gCtx.strokeStyle='#aab'; f7gCtx.lineWidth=0.8;
  f7gCtx.beginPath();f7gCtx.moveTo(FG.l,FG.t+FG.ph);f7gCtx.lineTo(FG.l+FG.pw,FG.t+FG.ph);f7gCtx.stroke();
  [20000,50000,100000,200000,500000,1000000].forEach(inc=>{
    const logI=Math.log10(inc);
    if (logI<FG_LMIN||logI>FG_LMAX) return;
    const x=FG.l+(logI-FG_LMIN)/(FG_LMAX-FG_LMIN)*FG.pw;
    f7gCtx.strokeStyle='#aab'; f7gCtx.lineWidth=0.8;
    f7gCtx.beginPath();f7gCtx.moveTo(x,FG.t+FG.ph);f7gCtx.lineTo(x,FG.t+FG.ph+5);f7gCtx.stroke();
    f7gCtx.fillStyle='#888'; f7gCtx.font='10px Spectral,serif'; f7gCtx.textAlign='center';
    f7gCtx.fillText(f7fmt(inc),x,FG.t+FG.ph+17); });
  f7gCtx.fillStyle='#556'; f7gCtx.font='italic 11px Lato,sans-serif'; f7gCtx.textAlign='center';
  f7gCtx.fillText('Household Income (log scale)',FG.l+FG.pw/2,FG.H-5);
}

/* ================================================================
   SIMULATION
   ================================================================ */
function f7simulate() {
  f7.generations=[]; f7.simDone=false;
  const fa={...f7.founders.A}; const fb={...f7.founders.B};
  fa.hhIncome=f7inc(fa.iqZ,fa.conscZ,fa.wealthLog);
  fb.hhIncome=f7inc(fb.iqZ,fb.conscZ,fb.wealthLog);
  f7.generations.push([fa,fb]);
  // Gen 1: founders as a couple
  const g1=[]; const nK1=Math.max(1,Math.min(5,Math.round(f7.kids+f7rn()*0.5)));
  const hh0=(fa.hhIncome+fb.hhIncome)/2;
  for (let k=0;k<nK1;k++) { const c=f7childOf(fa,fb,hh0); c.hhIncome=f7inc(c.iqZ,c.conscZ,c.wealthLog); g1.push(c); }
  f7.generations.push(g1);
  // Gen 2-5: each person finds an assortative partner
  for (let g=2;g<=5;g++) {
    const prev=f7.generations[g-1]; const next=[];
    // Limit parents to avoid explosion (max 80 parents → max 80*5=400 children, capped at 200)
    const parents=prev.length>80?Array.from({length:80},(_,i)=>prev[Math.floor(i*prev.length/80)]):prev;
    parents.forEach(p=>{
      const partner=f7part(p.iqZ,p.conscZ,p.wealthLog,f7.am);
      partner.hhIncome=f7inc(partner.iqZ,partner.conscZ,partner.wealthLog);
      const hh=(p.hhIncome+partner.hhIncome)/2;
      const nK=Math.max(1,Math.min(5,Math.round(f7.kids+f7rn()*0.5)));
      for (let k=0;k<nK;k++) { const c=f7childOf(p,partner,hh); c.hhIncome=f7inc(c.iqZ,c.conscZ,c.wealthLog); next.push(c); } });
    // Cap generation size
    f7.generations.push(next.length>200?Array.from({length:200},(_,i)=>next[Math.floor(i*next.length/200)]):next);
  }
  f7.simDone=true;
}

function f7animateReveal() {
  if (f7.displayedGens>=f7.generations.length) { f7.animating=false; return; }
  f7.displayedGens++;
  f7drawTrait(); f7drawWealth(); f7drawJoy(); f7drawWealthJoy(); f7updateStats();
  if (f7.displayedGens<f7.generations.length) setTimeout(f7animateReveal,800);
  else f7.animating=false;
}

/* ================================================================
   JOY-PLOT - WEALTH
   ================================================================ */
const f7WGC=document.getElementById('f7-wealth-joy-canvas');
const f7wgCtx=f7WGC.getContext('2d');
const FGW={W:960,H:300,l:90,t:15,r:20,b:42};
FGW.pw=FGW.W-FGW.l-FGW.r; FGW.ph=FGW.H-FGW.t-FGW.b;
// Wealth range matches the wealth positioning canvas
const FGW_LMIN=1.5, FGW_LMAX=7.8;
const f7gwX=lw=>FGW.l+(lw-FGW_LMIN)/(FGW_LMAX-FGW_LMIN)*FGW.pw;

function f7wkde(wLogs,logX) {
  if (!wLogs.length) return 0;
  const h=0.18; let d=0;
  wLogs.forEach(lw=>{ const z=(logX-lw)/h; d+=Math.exp(-0.5*z*z); });
  return d/(wLogs.length*h*Math.sqrt(2*Math.PI));
}

function f7drawWealthJoy() {
  f7wgCtx.clearRect(0,0,FGW.W,FGW.H);
  f7wgCtx.fillStyle='#fafaf8'; f7wgCtx.fillRect(0,0,FGW.W,FGW.H);
  if (!f7.simDone) {
    f7wgCtx.fillStyle='#aab'; f7wgCtx.font='italic 14px Spectral,serif'; f7wgCtx.textAlign='center';
    f7wgCtx.fillText('Click ▶ Simulate to see wealth trajectories across five generations',FGW.W/2,FGW.H/2);
    return;
  }
  // Reference lines
  [{v:5.29,label:'Population median $193k',col:'rgba(100,100,100,0.25)'},{v:Math.log10(1060000),label:'Mean $1.06M',col:'rgba(90,138,90,0.25)'}].forEach(({v,label,col})=>{
    const x=f7gwX(v); f7wgCtx.strokeStyle=col; f7wgCtx.lineWidth=1; f7wgCtx.setLineDash([4,3]);
    f7wgCtx.beginPath();f7wgCtx.moveTo(x,FGW.t);f7wgCtx.lineTo(x,FGW.t+FGW.ph);f7wgCtx.stroke();
    f7wgCtx.setLineDash([]);
    f7wgCtx.fillStyle=col; f7wgCtx.font='8px Spectral,serif'; f7wgCtx.textAlign='center';
    f7wgCtx.fillText(label,x,FGW.t+6); });
  // Vertical grid
  for (let e=2;e<=7;e++) {
    const x=f7gwX(e); f7wgCtx.strokeStyle='rgba(180,180,180,0.25)'; f7wgCtx.lineWidth=0.5; f7wgCtx.setLineDash([3,3]);
    f7wgCtx.beginPath();f7wgCtx.moveTo(x,FGW.t);f7wgCtx.lineTo(x,FGW.t+FGW.ph);f7wgCtx.stroke();
    f7wgCtx.setLineDash([]); }
  // Build KDE per generation
  const N_KDE=200;
  const kdeData=f7.generations.map(gen=>{
    const wLogs=gen.map(p=>p.wealthLog);
    const pts=[]; let maxD=0;
    for (let i=0;i<=N_KDE;i++) {
      const lx=FGW_LMIN+(FGW_LMAX-FGW_LMIN)*i/N_KDE;
      const d=f7wkde(wLogs,lx); pts.push(d); if(d>maxD)maxD=d; }
    return {pts,wLogs,maxD};
  });
  const WG_ROW_H=FGW.ph/N_ROWS;
  // Draw rows
  for (let g=0;g<N_ROWS;g++) {
    const rowY=FGW.t+g*WG_ROW_H; const col=GEN_ROW_COLS[g];
    if(g%2===0){f7wgCtx.fillStyle='rgba(0,0,0,0.018)';f7wgCtx.fillRect(FGW.l,rowY,FGW.pw,WG_ROW_H);}
    f7wgCtx.fillStyle=col; f7wgCtx.font='bold 10px Lato,sans-serif'; f7wgCtx.textAlign='right';
    f7wgCtx.fillText(GEN_LABELS[g],FGW.l-6,rowY+WG_ROW_H/2+4);
    f7wgCtx.strokeStyle='rgba(180,180,180,0.3)'; f7wgCtx.lineWidth=0.5;
    f7wgCtx.beginPath();f7wgCtx.moveTo(FGW.l,rowY+WG_ROW_H);f7wgCtx.lineTo(FGW.l+FGW.pw,rowY+WG_ROW_H);f7wgCtx.stroke();
    if (g>=f7.generations.length||g>=f7.displayedGens) continue;
    const {pts,wLogs,maxD}=kdeData[g]; if(!maxD) continue;
    const scaleH=WG_ROW_H*0.88;
    // Filled area
    f7wgCtx.beginPath(); f7wgCtx.moveTo(FGW.l,rowY+WG_ROW_H);
    for (let i=0;i<=N_KDE;i++) {
      const x=FGW.l+i/N_KDE*FGW.pw; const y=rowY+WG_ROW_H-(pts[i]/maxD)*scaleH; f7wgCtx.lineTo(x,y); }
    f7wgCtx.lineTo(FGW.l+FGW.pw,rowY+WG_ROW_H); f7wgCtx.closePath();
    f7wgCtx.fillStyle='rgba('+f7hex2rgb(col)+',0.22)'; f7wgCtx.fill();
    // Outline
    f7wgCtx.beginPath();
    for (let i=0;i<=N_KDE;i++) {
      const x=FGW.l+i/N_KDE*FGW.pw; const y=rowY+WG_ROW_H-(pts[i]/maxD)*scaleH;
      i===0?f7wgCtx.moveTo(x,y):f7wgCtx.lineTo(x,y); }
    f7wgCtx.strokeStyle=col; f7wgCtx.lineWidth=1.5; f7wgCtx.stroke();
    // Median line
    const sorted=[...wLogs].sort((a,b)=>a-b); const medLog=sorted[Math.floor(sorted.length/2)];
    const mx=f7gwX(medLog);
    f7wgCtx.strokeStyle=col; f7wgCtx.lineWidth=2;
    f7wgCtx.beginPath();f7wgCtx.moveTo(mx,rowY+4);f7wgCtx.lineTo(mx,rowY+WG_ROW_H-2);f7wgCtx.stroke();
    const lx2=Math.min(Math.max(mx,FGW.l+22),FGW.l+FGW.pw-22);
    f7wgCtx.fillStyle=col; f7wgCtx.font='bold 9px Lato,sans-serif'; f7wgCtx.textAlign='center';
    f7wgCtx.fillText(f7fmt(Math.pow(10,medLog)),lx2,rowY+11);
  }
  // X-axis
  f7wgCtx.strokeStyle='#aab'; f7wgCtx.lineWidth=0.8;
  f7wgCtx.beginPath();f7wgCtx.moveTo(FGW.l,FGW.t+FGW.ph);f7wgCtx.lineTo(FGW.l+FGW.pw,FGW.t+FGW.ph);f7wgCtx.stroke();
  const xlbls={2:'$100',3:'$1k',4:'$10k',5:'$100k',6:'$1M',7:'$10M'};
  for (let e=2;e<=7;e++) {
    const x=f7gwX(e);
    f7wgCtx.strokeStyle='#aab'; f7wgCtx.lineWidth=0.8;
    f7wgCtx.beginPath();f7wgCtx.moveTo(x,FGW.t+FGW.ph);f7wgCtx.lineTo(x,FGW.t+FGW.ph+5);f7wgCtx.stroke();
    f7wgCtx.fillStyle='#888'; f7wgCtx.font='10px Spectral,serif'; f7wgCtx.textAlign='center';
    f7wgCtx.fillText(xlbls[e],x,FGW.t+FGW.ph+17); }
  f7wgCtx.fillStyle='#556'; f7wgCtx.font='italic 11px Lato,sans-serif'; f7wgCtx.textAlign='center';
  f7wgCtx.fillText('Net Worth (log scale)',FGW.l+FGW.pw/2,FGW.H-5);
}

/* ================================================================
   STATS TABLE
   ================================================================ */
function f7updateStats() {
  const tbody=document.getElementById('f7-stats-body');
  if (!f7.simDone) { tbody.innerHTML='<tr><td colspan="5" style="text-align:center;color:#aab;padding:0.6rem;font-style:italic;">Run the simulation to see results</td></tr>'; return; }
  const labels=['Founders','Gen 1 (children)','Gen 2','Gen 3','Gen 4','Gen 5'];
  let html='';
  f7.generations.slice(0,f7.displayedGens).forEach((gen,g)=>{
    const incs=[...gen.map(p=>p.hhIncome)].sort((a,b)=>a-b);
    const ws=[...gen.map(p=>Math.pow(10,p.wealthLog))].sort((a,b)=>a-b);
    const avgIQ=gen.reduce((s,p)=>s+p.iqZ,0)/gen.length;
    const avgIQpts=Math.round(100+avgIQ*15);
    const medInc=incs[Math.floor(incs.length/2)], medW=ws[Math.floor(ws.length/2)];
    const col=g===0?'#8b3a1e':GEN_ROW_COLS[g];
    html+=`<tr style="border-bottom:1px solid #eee;">
      <td style="padding:0.3rem 0.6rem;color:${col};font-weight:700;">${labels[g]}</td>
      <td style="text-align:right;padding:0.3rem 0.6rem;">${gen.length}</td>
      <td style="text-align:right;padding:0.3rem 0.6rem;">${f7fmt(medInc)}</td>
      <td style="text-align:right;padding:0.3rem 0.6rem;">${f7fmt(medW)}</td>
      <td style="text-align:right;padding:0.3rem 0.6rem;">${avgIQpts}</td></tr>`;
  });
  tbody.innerHTML=html;
}

/* ================================================================
   INTERACTION - TRAIT CANVAS
   ================================================================ */
let f7tDrag=false;
function f7traitMove(e) {
  const rect=f7TC.getBoundingClientRect();
  const px=(e.clientX-rect.left)*FT.W/rect.width, py=(e.clientY-rect.top)*FT.H/rect.height;
  f7.founders[f7.active].iqZ   =Math.max(-3.2,Math.min(3.2,f7tInvX(px)));
  f7.founders[f7.active].conscZ=Math.max(-3.2,Math.min(3.2,f7tInvY(py)));
  f7drawTrait();
}
f7TC.addEventListener('mousedown', e=>{f7tDrag=true;f7traitMove(e);});
f7TC.addEventListener('mousemove', e=>{if(f7tDrag)f7traitMove(e);});
f7TC.addEventListener('mouseup', ()=>f7tDrag=false);
f7TC.addEventListener('mouseleave',()=>f7tDrag=false);
f7TC.addEventListener('touchstart',e=>{e.preventDefault();f7tDrag=true;f7traitMove(e.touches[0]);},{passive:false});
f7TC.addEventListener('touchmove', e=>{e.preventDefault();if(f7tDrag)f7traitMove(e.touches[0]);},{passive:false});
f7TC.addEventListener('touchend', ()=>f7tDrag=false);

/* ================================================================
   INTERACTION - WEALTH CANVAS
   ================================================================ */
let f7wDrag=false;
function f7wealthMove(e) {
  const rect=f7WC.getBoundingClientRect();
  const px=(e.clientX-rect.left)*FW.W/rect.width;
  f7.founders[f7.active].wealthLog=Math.max(FW_LMIN+0.1,Math.min(FW_LMAX-0.1,f7wInvX(px)));
  f7drawWealth();
}
f7WC.addEventListener('mousedown', e=>{f7wDrag=true;f7wealthMove(e);});
f7WC.addEventListener('mousemove', e=>{if(f7wDrag)f7wealthMove(e);});
f7WC.addEventListener('mouseup', ()=>f7wDrag=false);
f7WC.addEventListener('mouseleave',()=>f7wDrag=false);
f7WC.addEventListener('touchstart',e=>{e.preventDefault();f7wDrag=true;f7wealthMove(e.touches[0]);},{passive:false});
f7WC.addEventListener('touchmove', e=>{e.preventDefault();if(f7wDrag)f7wealthMove(e.touches[0]);},{passive:false});
f7WC.addEventListener('touchend', ()=>f7wDrag=false);

/* ================================================================
   CONTROLS
   ================================================================ */
function f7setActive(key) {
  f7.active=key;
  const a=document.getElementById('f7-person-a'), b=document.getElementById('f7-person-b');
  a.style.background=key==='A'?'#8b3a1e':'white'; a.style.color=key==='A'?'white':'#8b3a1e';
  b.style.background=key==='B'?'#1a5c8a':'white'; b.style.color=key==='B'?'white':'#1a5c8a';
  f7drawTrait(); f7drawWealth();
}
document.getElementById('f7-person-a').addEventListener('click',()=>f7setActive('A'));
document.getElementById('f7-person-b').addEventListener('click',()=>f7setActive('B'));
document.getElementById('f7-sim-btn').addEventListener('click',()=>{
  f7simulate(); f7.displayedGens=0; f7.animating=true; setTimeout(f7animateReveal,300); });
document.getElementById('f7-reset-btn').addEventListener('click',()=>{
  f7.generations=[]; f7.simDone=false; f7.displayedGens=0; f7.animating=false;
  f7drawTrait(); f7drawWealth(); f7drawJoy(); f7drawWealthJoy(); f7updateStats(); });
document.getElementById('f7-kids').addEventListener('input',e=>{
  f7.kids=e.target.value/10; document.getElementById('f7-kids-val').textContent=f7.kids.toFixed(1); });
document.getElementById('f7-am').addEventListener('input',e=>{
  f7.am=e.target.value/100; document.getElementById('f7-am-val').textContent=f7.am.toFixed(2); });
document.getElementById('f7-biq').addEventListener('input',e=>{
  F7_B_IQ=e.target.value/100; document.getElementById('f7-biq-val').textContent=F7_B_IQ.toFixed(2); });

/* ================================================================
   INIT
   ================================================================ */
f7buildTCache();
f7buildWDens();
f7drawTrait();
f7drawWealth();
f7drawJoy();
f7drawWealthJoy();
})();

/* ============================================================
   FIGURE 9 - WHERE ARE YOU?
   ============================================================ */
(function () {
  var iqSlider    = document.getElementById('f9-iq');
  if (!iqSlider) return;
  var wSlider     = document.getElementById('f9-wealth');
  var readySlider = document.getElementById('f9-ready');
  var iqLabel     = document.getElementById('f9-iq-label');
  var wLabel      = document.getElementById('f9-wealth-label');
  var readyLabel  = document.getElementById('f9-ready-label');
  var incNowEl    = document.getElementById('f9-income-now');
  var incAiEl     = document.getElementById('f9-income-ai');
  var incAiNote   = document.getElementById('f9-income-ai-note');
  var oppEl       = document.getElementById('f9-opportunity');
  var cActW       = document.getElementById('f9-child-act-wealth');
  var cActT       = document.getElementById('f9-child-act-tier');
  var cActI       = document.getElementById('f9-child-act-income');
  var cNoW        = document.getElementById('f9-child-no-wealth');
  var cNoT        = document.getElementById('f9-child-no-tier');
  var cNoI        = document.getElementById('f9-child-no-income');

  var BASE = 75000;
  var B_IQ_NOW = 0.35, B_W_NOW = 0.45;
  var B_IQ_AI  = 0.10, B_W_AI  = 0.65;
  var THRESHOLD = 20000;
  var WINDOW_YEARS = 6;
  var ACT_READINESS = 80;

  var WEALTH_PTS = [
    [1, 200], [10, 800], [20, 4000], [30, 9000], [40, 17000],
    [50, 30000], [60, 52000], [70, 88000], [80, 148000],
    [90, 310000], [99, 1800000]
  ];

  // Probit: Peter Acklam rational approximation
  function probit(p) {
    var a = [-3.969683028665376e+01, 2.209460984245205e+02,
             -2.759285104469687e+02, 1.383577518672690e+02,
             -3.066479806614716e+01, 2.506628277459239e+00];
    var b = [-5.447609879822406e+01, 1.615858368580409e+02,
             -1.556989798598866e+02, 6.680131188771972e+01,
             -1.328068155288572e+01];
    var c = [-7.784894002430293e-03, -3.223964580411365e-01,
             -2.400758277161838e+00, -2.549732539343734e+00,
              4.374664141464968e+00,  2.938163982698783e+00];
    var d = [7.784695709041462e-03, 3.224671290700398e-01,
             2.445134137142996e+00, 3.754408661907416e+00];
    var p_lo = 0.02425, p_hi = 1 - p_lo, q, r;
    if (p < p_lo) {
      q = Math.sqrt(-2 * Math.log(p));
      return (((((c[0]*q+c[1])*q+c[2])*q+c[3])*q+c[4])*q+c[5]) /
             ((((d[0]*q+d[1])*q+d[2])*q+d[3])*q+1);
    } else if (p <= p_hi) {
      q = p - 0.5; r = q*q;
      return (((((a[0]*r+a[1])*r+a[2])*r+a[3])*r+a[4])*r+a[5])*q /
             (((((b[0]*r+b[1])*r+b[2])*r+b[3])*r+b[4])*r+1);
    } else {
      q = Math.sqrt(-2 * Math.log(1-p));
      return -(((((c[0]*q+c[1])*q+c[2])*q+c[3])*q+c[4])*q+c[5]) /
               ((((d[0]*q+d[1])*q+d[2])*q+d[3])*q+1);
    }
  }

  function wealthDollars(pct) {
    for (var i = 0; i < WEALTH_PTS.length - 1; i++) {
      if (pct <= WEALTH_PTS[i+1][0]) {
        var t = (pct - WEALTH_PTS[i][0]) / (WEALTH_PTS[i+1][0] - WEALTH_PTS[i][0]);
        return WEALTH_PTS[i][1] + t * (WEALTH_PTS[i+1][1] - WEALTH_PTS[i][1]);
      }
    }
    return WEALTH_PTS[WEALTH_PTS.length-1][1];
  }

  function dollarsToZ(dollars) {
    var pct = WEALTH_PTS[0][0];
    for (var i = 0; i < WEALTH_PTS.length - 1; i++) {
      if (dollars <= WEALTH_PTS[i+1][1]) {
        var t = (dollars - WEALTH_PTS[i][1]) / (WEALTH_PTS[i+1][1] - WEALTH_PTS[i][1]);
        pct = WEALTH_PTS[i][0] + t * (WEALTH_PTS[i+1][0] - WEALTH_PTS[i][0]);
        break;
      }
      pct = WEALTH_PTS[i+1][0];
    }
    pct = Math.max(1, Math.min(99, pct));
    return probit(pct / 100);
  }

  function fmt(n) {
    return '$' + Math.round(n).toLocaleString();
  }

  function fmtK(n) {
    if (Math.abs(n) >= 1000) return '$' + Math.round(n / 1000) + 'k';
    return '$' + Math.round(n);
  }

  function tierHTML(dollars) {
    if (dollars >= THRESHOLD) {
      return '<span style="color:#2e7d32; font-weight:700;">&#10003; above $20k - compounding active</span>';
    } else {
      return '<span style="color:#8b3a1e; font-weight:700;">&#10007; below $20k - compounding inactive</span>';
    }
  }

  function update() {
    var iqPct     = parseInt(iqSlider.value);
    var wPct      = parseInt(wSlider.value);
    var readiness = parseInt(readySlider.value);

    iqLabel.textContent    = iqPct + 'th pct';
    wLabel.textContent     = wPct + 'th pct';
    readyLabel.textContent = readiness + ' / 100';

    var zIQ = probit(iqPct / 100);
    var zW  = probit(wPct  / 100);

    var incNow = BASE * Math.exp(B_IQ_NOW * zIQ + B_W_NOW * zW);
    var incAI  = BASE * Math.exp(B_IQ_AI  * zIQ + B_W_AI  * zW);

    incNowEl.textContent = fmt(incNow) + ' / yr';
    incAiEl.textContent  = fmt(incAI)  + ' / yr';

    if (incAI < incNow) {
      incAiEl.style.color   = '#8b3a1e';
      incAiNote.textContent = 'per year \u2014 lower than today';
    } else {
      incAiEl.style.color   = '#1a5c8a';
      incAiNote.textContent = 'per year \u2014 wealth position gains';
    }

    // Window opportunity (delta: acting at readiness=80 vs current)
    var modifier      = 1 + 0.25 * Math.max(0, zIQ);
    var annualCurrent = (readiness / 100) * 65000 * modifier;
    var annualActing  = (ACT_READINESS / 100) * 65000 * modifier;
    var lifetimeDelta = Math.max(0, annualActing - annualCurrent) * WINDOW_YEARS;
    var wealthDelta   = lifetimeDelta * 0.20;

    if (readiness >= ACT_READINESS) {
      oppEl.innerHTML = '<span style="color:#6f777d; font-size:0.9rem;">Window largely captured \u2014 readiness already at acting threshold</span>';
    } else {
      oppEl.innerHTML = fmtK(lifetimeDelta) + ' lifetime<br>' +
        '<span style="font-size:0.9rem; color:#6f777d;">' + fmtK(wealthDelta) + ' estimated wealth</span>';
    }

    // Children's table
    var parentDollars = wealthDollars(wPct);
    var childNoAct    = parentDollars * 0.5;
    var childAct      = parentDollars * 0.5 + wealthDelta * 0.5;

    var zChildIQ   = 0.5 * zIQ;
    var zChildWNo  = dollarsToZ(childNoAct);
    var zChildWAct = dollarsToZ(childAct);

    var incChildNo  = BASE * Math.exp(B_IQ_AI * zChildIQ + B_W_AI * zChildWNo);
    var incChildAct = BASE * Math.exp(B_IQ_AI * zChildIQ + B_W_AI * zChildWAct);

    cActW.textContent = fmt(childAct);
    cActT.innerHTML   = tierHTML(childAct);
    cActI.textContent = fmt(incChildAct) + ' / yr';
    cActI.style.color = '#1a5c8a';

    cNoW.textContent = fmt(childNoAct);
    cNoT.innerHTML   = tierHTML(childNoAct);
    cNoI.textContent = fmt(incChildNo) + ' / yr';
    cNoI.style.color = '#8b3a1e';
  }

  iqSlider.addEventListener('input', update);
  wSlider.addEventListener('input', update);
  readySlider.addEventListener('input', update);
  update();
})();

/* ============================================================
   FIGURE 8 - THE REPRICING
   ============================================================ */
(function () {
  const canvas  = document.getElementById('f8-canvas');
  if (!canvas) return;
  const ctx     = canvas.getContext('2d');
  const slider  = document.getElementById('f8-speed');
  const labelEl = document.getElementById('f8-speed-label');
  const crossEl = document.getElementById('f8-crossing-year');
  const winEl   = document.getElementById('f8-window-years');
  const gapEl   = document.getElementById('f8-gap-2040');

  const W = 960, H = 420;
  const mg = { top: 52, right: 160, bottom: 56, left: 82 };
  const NOW = 2026, Y_START = 2010, Y_END = 2040;
  const BASE = 75000;
  const Z_IQ_A = 1.5, Z_W_B = 0.84;
  const B_I_HIST = 0.38, B_W_HIST = 0.40;

  const SCENARIOS = {
    slow:   { mid: 2035, k: 0.6, bIQ: 0.15, bW: 0.60 },
    medium: { mid: 2031, k: 0.8, bIQ: 0.10, bW: 0.65 },
    fast:   { mid: 2028, k: 1.0, bIQ: 0.08, bW: 0.68 }
  };

  function lerp(a, b, t) { return a + (b - a) * t; }

  function getScenario(p) {
    if (p <= 50) {
      const t = p / 50;
      return {
        mid: lerp(SCENARIOS.slow.mid, SCENARIOS.medium.mid, t),
        k:   lerp(SCENARIOS.slow.k,   SCENARIOS.medium.k,   t),
        bIQ: lerp(SCENARIOS.slow.bIQ, SCENARIOS.medium.bIQ, t),
        bW:  lerp(SCENARIOS.slow.bW,  SCENARIOS.medium.bW,  t)
      };
    } else {
      const t = (p - 50) / 50;
      return {
        mid: lerp(SCENARIOS.medium.mid, SCENARIOS.fast.mid, t),
        k:   lerp(SCENARIOS.medium.k,   SCENARIOS.fast.k,   t),
        bIQ: lerp(SCENARIOS.medium.bIQ, SCENARIOS.fast.bIQ, t),
        bW:  lerp(SCENARIOS.medium.bW,  SCENARIOS.fast.bW,  t)
      };
    }
  }

  function sig(year, mid, k) {
    return 1 / (1 + Math.exp(-k * (year - mid)));
  }

  function getCoeffs(year, sc) {
    const s = sig(year, sc.mid, sc.k);
    return {
      bIQ: sc.bIQ + (B_I_HIST - sc.bIQ) * (1 - s),
      bW:  sc.bW  + (B_W_HIST  - sc.bW)  * (1 - s)
    };
  }

  function getIncomes(year, sc) {
    const { bIQ, bW } = getCoeffs(year, sc);
    return {
      a: BASE * Math.exp(bIQ * Z_IQ_A),
      b: BASE * Math.exp(bW  * Z_W_B)
    };
  }

  function findCrossing(sc) {
    for (let y = Y_START; y <= Y_END; y += 0.05) {
      const { a, b } = getIncomes(y, sc);
      if (b >= a) return y;
    }
    return Y_END + 1;
  }

  function xPos(year) {
    return mg.left + (year - Y_START) / (Y_END - Y_START) * (W - mg.left - mg.right);
  }
  function yPos(income) {
    const Y_MIN = 60000, Y_MAX = 165000;
    return mg.top + (1 - (income - Y_MIN) / (Y_MAX - Y_MIN)) * (H - mg.top - mg.bottom);
  }

  function draw() {
    const p  = parseInt(slider.value);
    const sc = getScenario(p);
    const cx = findCrossing(sc);

    if (p < 25)       labelEl.textContent = 'Slow';
    else if (p < 75)  labelEl.textContent = 'Medium';
    else              labelEl.textContent = 'Fast';

    ctx.clearRect(0, 0, W, H);

    // grid
    ctx.strokeStyle = '#eee'; ctx.lineWidth = 1;
    [80, 100, 120, 140, 160].forEach(function(k) {
      var y = yPos(k * 1000);
      ctx.beginPath(); ctx.moveTo(mg.left, y); ctx.lineTo(W - mg.right, y); ctx.stroke();
    });

    // shaded window region (2025 → crossing)
    if (cx <= Y_END) {
      ctx.fillStyle = 'rgba(245,230,208,0.55)';
      ctx.fillRect(xPos(NOW), mg.top, xPos(Math.min(cx, Y_END)) - xPos(NOW), H - mg.top - mg.bottom);
    }

    // Now line
    ctx.save();
    ctx.setLineDash([5, 4]);
    ctx.strokeStyle = '#aaa'; ctx.lineWidth = 1.5;
    ctx.beginPath(); ctx.moveTo(xPos(NOW), mg.top - 8); ctx.lineTo(xPos(NOW), H - mg.bottom); ctx.stroke();
    ctx.restore();
    ctx.fillStyle = '#888'; ctx.font = '600 11px sans-serif'; ctx.textAlign = 'center';
    ctx.fillText('Now', xPos(NOW), mg.top - 14);

    // "the window" label
    if (cx > NOW && cx <= Y_END) {
      var midX = (xPos(NOW) + xPos(cx)) / 2;
      ctx.fillStyle = '#8b3a1e';
      ctx.font = 'italic 12px serif';
      ctx.textAlign = 'center';
      ctx.fillText('the window', midX, mg.top + 16);
    }

    // crossing vertical line
    if (cx <= Y_END) {
      ctx.save();
      ctx.setLineDash([4, 3]);
      ctx.strokeStyle = '#8b3a1e'; ctx.lineWidth = 1.5;
      ctx.beginPath(); ctx.moveTo(xPos(cx), mg.top); ctx.lineTo(xPos(cx), H - mg.bottom); ctx.stroke();
      ctx.restore();
      ctx.fillStyle = '#8b3a1e';
      ctx.font = '700 11px sans-serif'; ctx.textAlign = 'center';
      ctx.fillText(Math.round(cx).toString(), xPos(cx), H - mg.bottom + 16);
    }

    // income lines
    function drawLine(getVal, color) {
      for (var pass = 0; pass < 2; pass++) {
        var yFrom = pass === 0 ? Y_START : NOW;
        var yTo   = pass === 0 ? NOW     : Y_END;
        ctx.beginPath();
        ctx.strokeStyle = color;
        ctx.lineWidth = 2.5;
        ctx.globalAlpha = pass === 0 ? 0.5 : 1.0;
        var first = true;
        for (var yr = yFrom; yr <= yTo + 0.01; yr += 0.1) {
          var inc = getVal(yr, sc);
          var px = xPos(yr), py = yPos(inc);
          if (first) { ctx.moveTo(px, py); first = false; } else ctx.lineTo(px, py);
        }
        ctx.stroke();
      }
      ctx.globalAlpha = 1.0;
    }

    drawLine(function(y, s) { return getIncomes(y, s).a; }, '#8b3a1e');
    drawLine(function(y, s) { return getIncomes(y, s).b; }, '#1a5c8a');

    // line labels at right edge
    var aEnd = getIncomes(Y_END, sc).a;
    var bEnd = getIncomes(Y_END, sc).b;
    ctx.font = '600 11px sans-serif'; ctx.textAlign = 'left';
    ctx.fillStyle = '#8b3a1e';
    ctx.fillText('A: High IQ / Median Wealth', xPos(Y_END) + 8, yPos(aEnd) + 4);
    ctx.fillStyle = '#1a5c8a';
    ctx.fillText('B: Median IQ / Top-Quintile Wealth', xPos(Y_END) + 8, yPos(bEnd) + 4);

    // axes
    ctx.strokeStyle = '#ccc'; ctx.lineWidth = 1; ctx.globalAlpha = 1;
    ctx.beginPath();
    ctx.moveTo(mg.left, mg.top); ctx.lineTo(mg.left, H - mg.bottom);
    ctx.lineTo(W - mg.right, H - mg.bottom); ctx.stroke();

    // x-axis ticks
    ctx.fillStyle = '#666'; ctx.font = '11px sans-serif'; ctx.textAlign = 'center';
    [2010, 2015, 2020, 2025, 2030, 2035, 2040].forEach(function(y) {
      ctx.fillText(y, xPos(y), H - mg.bottom + 18);
      ctx.beginPath(); ctx.strokeStyle = '#bbb'; ctx.lineWidth = 1;
      ctx.moveTo(xPos(y), H - mg.bottom); ctx.lineTo(xPos(y), H - mg.bottom + 5); ctx.stroke();
    });

    // y-axis ticks
    ctx.textAlign = 'right';
    [80, 100, 120, 140, 160].forEach(function(k) {
      ctx.fillStyle = '#666';
      ctx.fillText('$' + k + 'k', mg.left - 8, yPos(k * 1000) + 4);
    });

    // y-axis label
    ctx.save();
    ctx.translate(18, H / 2); ctx.rotate(-Math.PI / 2);
    ctx.fillStyle = '#555'; ctx.font = '12px sans-serif'; ctx.textAlign = 'center';
    ctx.fillText('Expected household income', 0, 0);
    ctx.restore();

    // stats row
    if (cx <= Y_END) {
      crossEl.textContent = Math.round(cx).toString();
      var remaining = Math.max(0, cx - NOW);
      winEl.textContent = remaining < 0.5 ? 'Closed' : remaining.toFixed(1) + ' years';
    } else {
      crossEl.textContent = '>' + Y_END;
      winEl.textContent = (Y_END - NOW) + '+ years';
    }
    var gap2040 = getIncomes(Y_END, sc).b - getIncomes(Y_END, sc).a;
    gapEl.textContent = '+$' + Math.round(gap2040 / 1000) + 'k / year';
  }

  slider.addEventListener('input', draw);
  draw();
})();

</script>]]></content><author><name>Approaching 50%</name></author><category term="M &amp; E" /><category term="AI" /><category term="probability" /><category term="genetics" /><category term="inequality" /><category term="AI" /><category term="gaussian" /><category term="wealth" /><category term="inheritance" /><summary type="html"><![CDATA[For two centuries, the credential system gave intelligence a route to heritable capital. Artificial intelligence is closing that route. This essay builds the argument from first principles - with probability theory, interactive simulations, and a prediction specific enough to be falsifiable - and puts a number on the window that remains.]]></summary></entry><entry><title type="html">Mit adtak nekünk a magyarok?</title><link href="https://danielhomola.com/m%20&%20e/history/mit-adtak-nekunk-a-magyarok/" rel="alternate" type="text/html" title="Mit adtak nekünk a magyarok?" /><published>2025-09-06T00:00:00+02:00</published><updated>2025-09-06T00:00:00+02:00</updated><id>https://danielhomola.com/m%20&amp;%20e/history/mit-adtak-nekunk-a-magyarok</id><content type="html" xml:base="https://danielhomola.com/m%20&amp;%20e/history/mit-adtak-nekunk-a-magyarok/"><![CDATA[<blockquote class="notice--primary">
  <p>This is post is part of my <a href="/m%20&amp;%20e/letters-to-m-and-e/"><strong>Letters to M &amp; E</strong></a> series.</p>
</blockquote>

<blockquote class="notice--warning">
  <p>This is the original Hungarian post. <a href="/m%20&amp;%20e/history/what-have-the-hungarians-given-us/"><strong>Here’s the English version</strong></a>.</p>
</blockquote>

<h1 id="előszó">Előszó</h1>

<p>A “Brian élete” című örök klasszikus egyik legviccesebb jelenete mikor egy csapatnyi  felbőszült zsidó azon ármánykodik, hogyan fogják Pilatus feleségét elrabolni és ezzel a függetlenedési követeléseiknek érvényt szerezni. A közösség vezetője, miután elsorolja, hogy a rohadt rómaiak kiszipolyozták már az apáikat is (és az apáik apáit is, sőt az apáik, apáinak, apáit is), azt a provokatívnak szánt - azóta szállóígévé vált - kérdést teszi fel, hogy <em>“Mit adtak nekünk a rómaiak?”.</em></p>

<p>Aki látta, biztosan emlékszik, hogy a várt hőzöngés valamint a “Nagy büdös semmit!” és hasonló válaszok helyett, az ellenállók csapatából elkezdenek záporozni a nem várt válaszok: “vízvezetéket”, “csatornázást”, “utakat”, “öntözést”, “gyógyászatot”, “oktatást”, “bort”, “közbiztonságot”, sőt a végén kiderül, hogy a rómaiak “ elhozták a békét” is. Őszintén irigylem aki még nem látta és most először nézheti meg, de itt a <a href="https://youtu.be/J2Bx19qJ_Vs">link</a> a tényleg kivételesen jó magyar szinkronos jelenethez.</p>

<p>Már 9 éve, hogy előző <a href="https://medium.com/@dani.homola/ki-bev%C3%A1ndorl%C3%B3-913ce21d725f">“Ki-, bevándorló” posztomat</a> írtam. Azóta sem élünk Magyarországon, csak többen lettünk és egy másik országba költöztünk. Viszont lassan-lassan negyvenhez közeledek és így egyre többet foglalkoztat a családunk története. Nemrég eszembe ötlött, hogy én hogyan felelnék, ha a fenti jelentben találnám magam, csak épp az érdekesség kedvéért, Rómát Magyarországra cserélnénk. A kérdés tehát:  <em>“Mit adtak nekünk a magyarok?”</em></p>

<p>Azt gondolom, hogy mindenkinek lesz erre a furcsa kérdésre egy válasza, amit a saját eredet és családtörténete határoz meg. Függetlenül attól, hogyan szól ez a válasz, én őszintén bátorítanék mindenkit, hogy végezze el a kérdés megválaszolásához szükséges szellemi és lelki munkát, mert az katartikus tud lenni. Nekem az volt.</p>

<p>Íme az én, illetve a mi válaszunk, melyet a követhetőség kedvéért, a négy nagyszülőm közvetlen családjának történeteiből állítottam össze, pusztán keresztneveket használva, hogy a személyek pontos kilétét ne tegyem teljesen publikussá.</p>

<h1 id="apai-nagypapám-ága">Apai nagypapám ága</h1>

<p><img src="/assets/images/family_pics/rudolf.jpg" alt="image-left" class="align-left avatar" /> Szépapám, Rudolf a monarchia idején, a mai Szlovákia területén, Nagyrőcén, az első szlovák gimnázium igazgatója és evangélikus káplán volt. Az, hogy az erőszakos magyarosítás korában, lehetősége nyílott egy-egy városnak szlovákul tanítani a diákjait, akkora dolog volt, hogy szépapámnak, a mai napig emléktábla őrzi a nevét Nagyrőce múzeumában. Az 1860-as, 70-es évekre, a magyarok  bezáratták szinte az összes szlovák nyelvű gimnáziumot, mivel ezeket a szlovák elit képzésének előszobájának és így a szlovák nemzeti mozgalom tüzifájának tekintették. A kor rövidlátó politikája szerint ezen intézmények gátat vetettek volna az erőltetett magyarosításnak, mely ekkora már javában zajlott. Így történt, hogy 1874-ben szépapám által vezetett gimnáziumot is bezáratták. Rudolf Nagyrőcén halt meg 24 évre rá.</p>

<p>Zárójeles megjegyzés: Szépapám kortársa volt és szintén Nagyrőcén született majd nőtt fel, az a <a href="https://www.wikiwand.com/hu/articles/Rochlitz_Gyula_\(%C3%A9p%C3%ADt%C3%A9sz\)">Rochlitz Gyula</a> aki amúgy a Keleti pályaudvar főépületét tervezte. Ő egy szász családból származó, bécsi egyetemen tanult, Nyugat Európába emigrált, majd Budapestre visszatért építész volt, akinek a története jól mutatja nem csak a hihetetlen népi és kulturális változatosságát a monarchiának, hanem az abban rejlő lehetőségeket is. Zárójel bezárva.</p>

<p><img src="/assets/images/family_pics/gyula.jpg" alt="image-left" class="align-right avatar" /> 
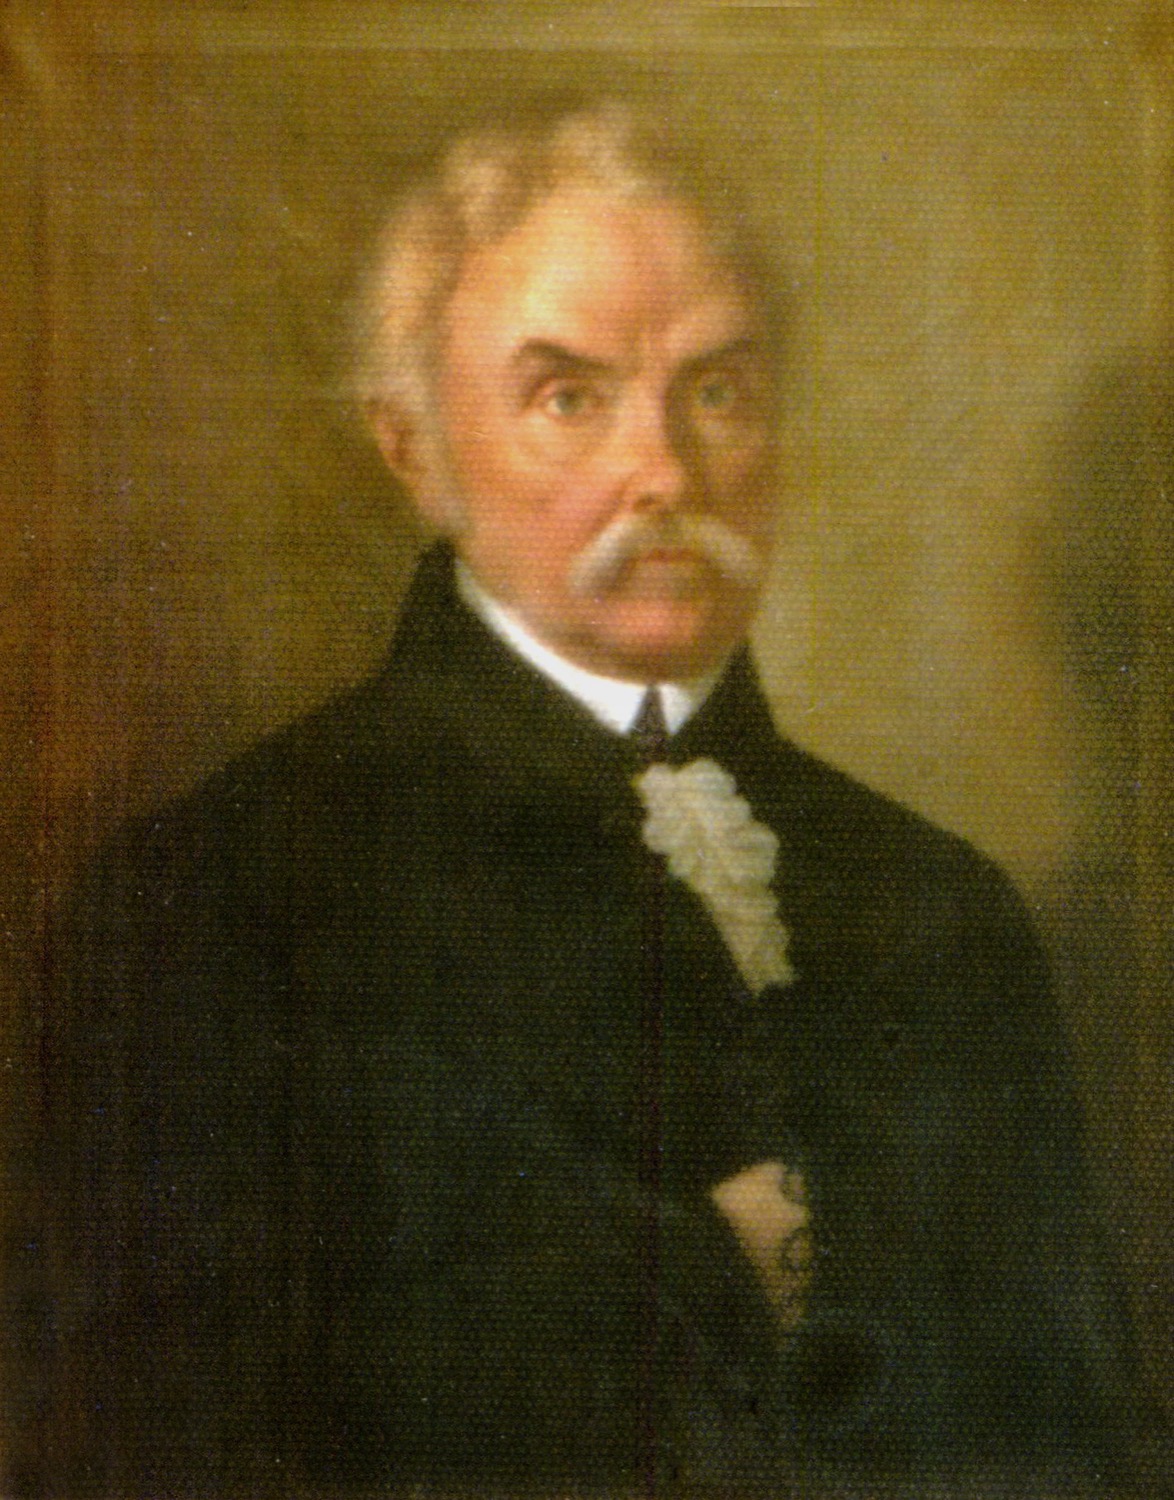
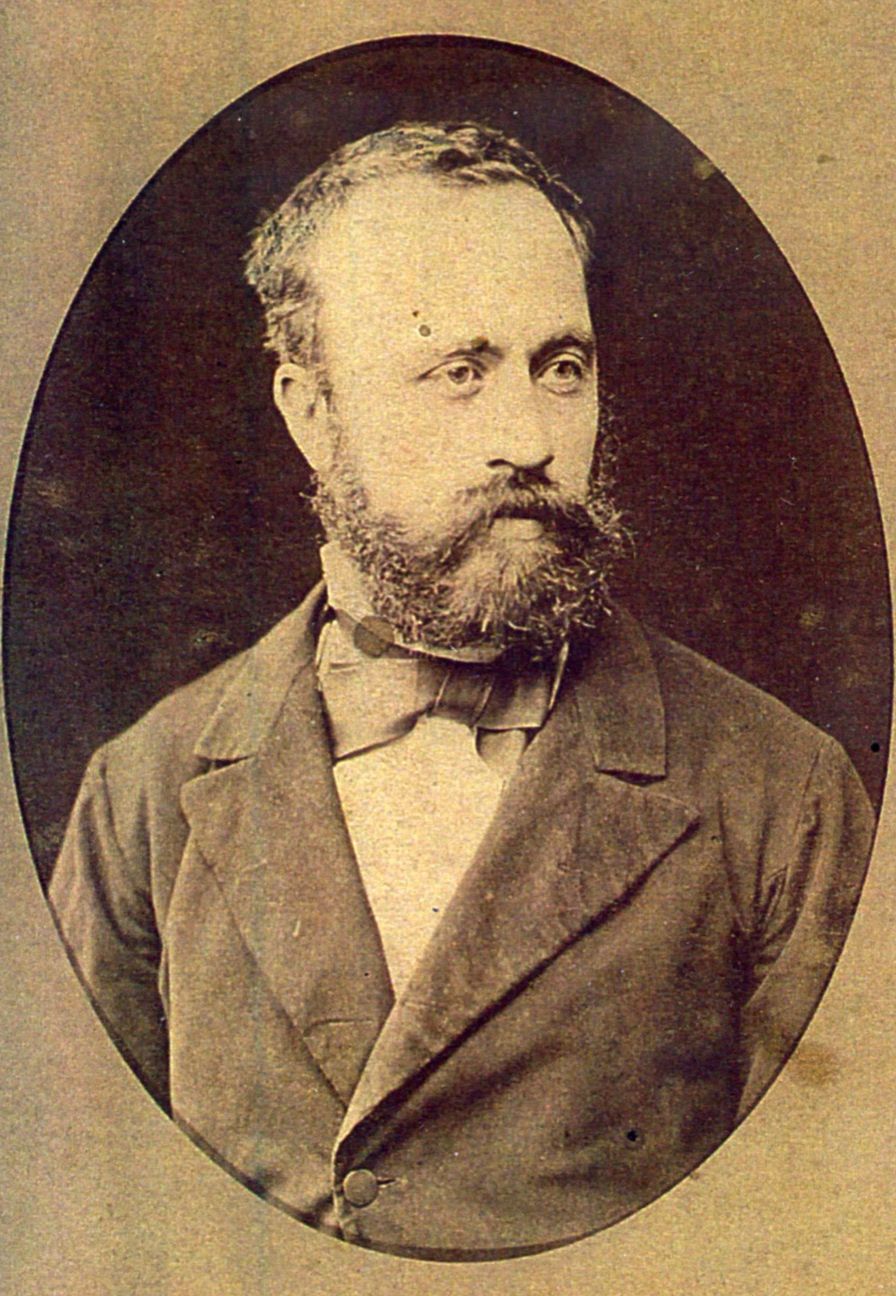
Apai ükapám, Gyula már zömében Nagybányán élt és halt is meg. Bányaszámvevőségi főnökként dolgozott, a Vár utcában volt házuk, kettő fia és három lánya született. Fiatalabb fia, Viktor Lajos az én a dédapám, aki mint okleveles mérnök egy sor városban betöltött pozíció után végül Pécsett telepedett le és itt is halt meg a mecseki szőlőjében.  Eddigre a család egyértelműen elmagyarosodott.</p>

<p><img src="/assets/images/family_pics/roza.jpg" alt="image-left" class="align-left avatar" /> 
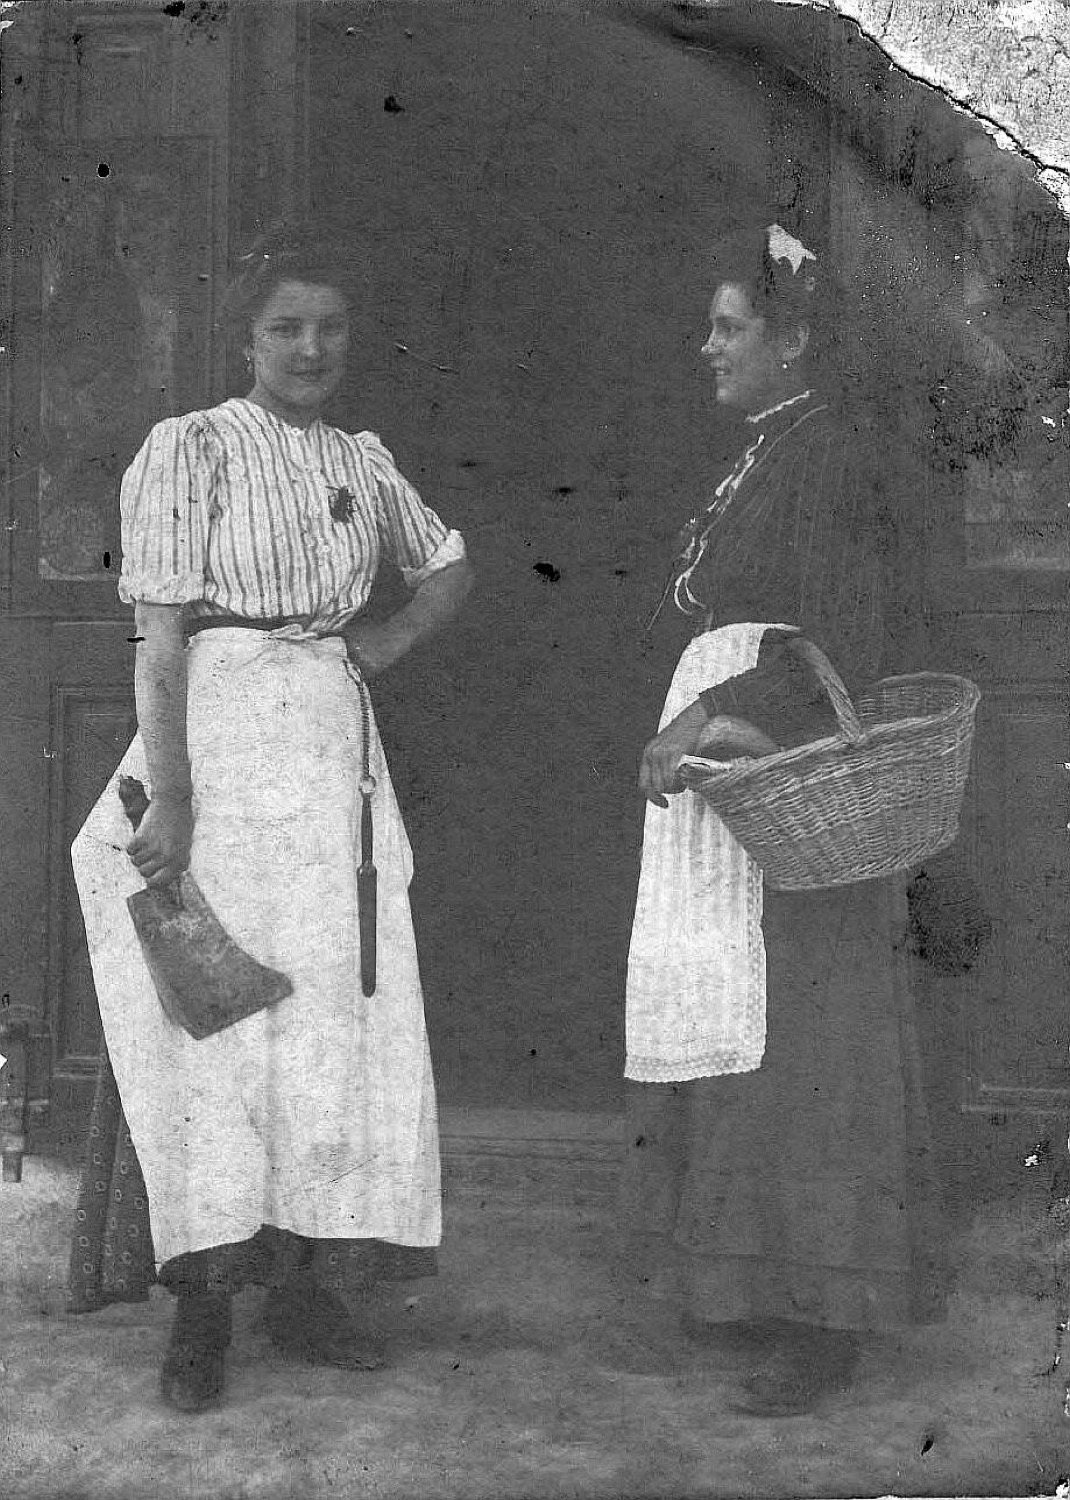
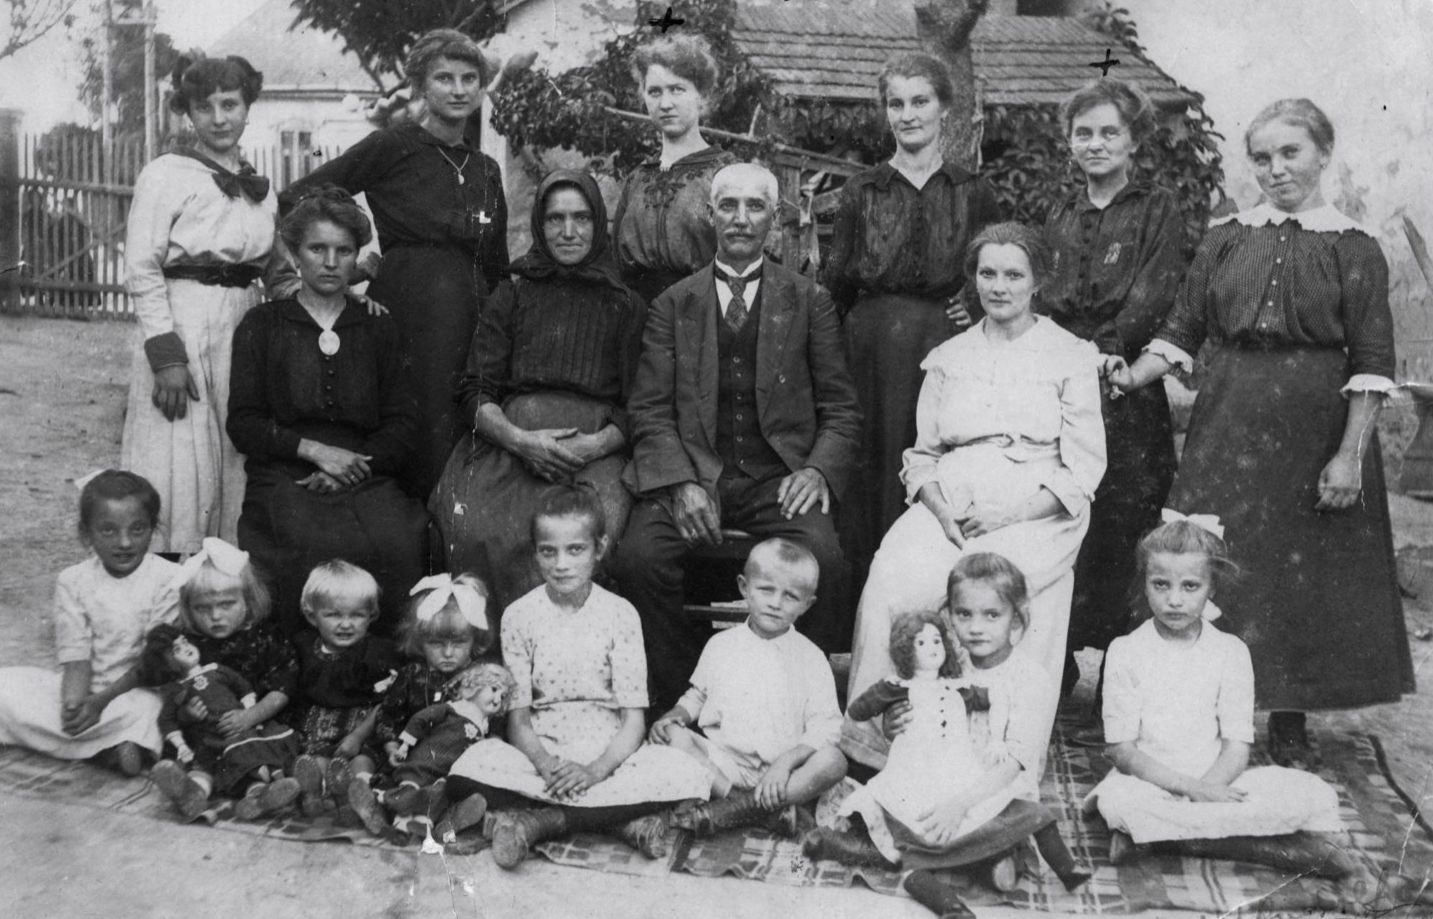
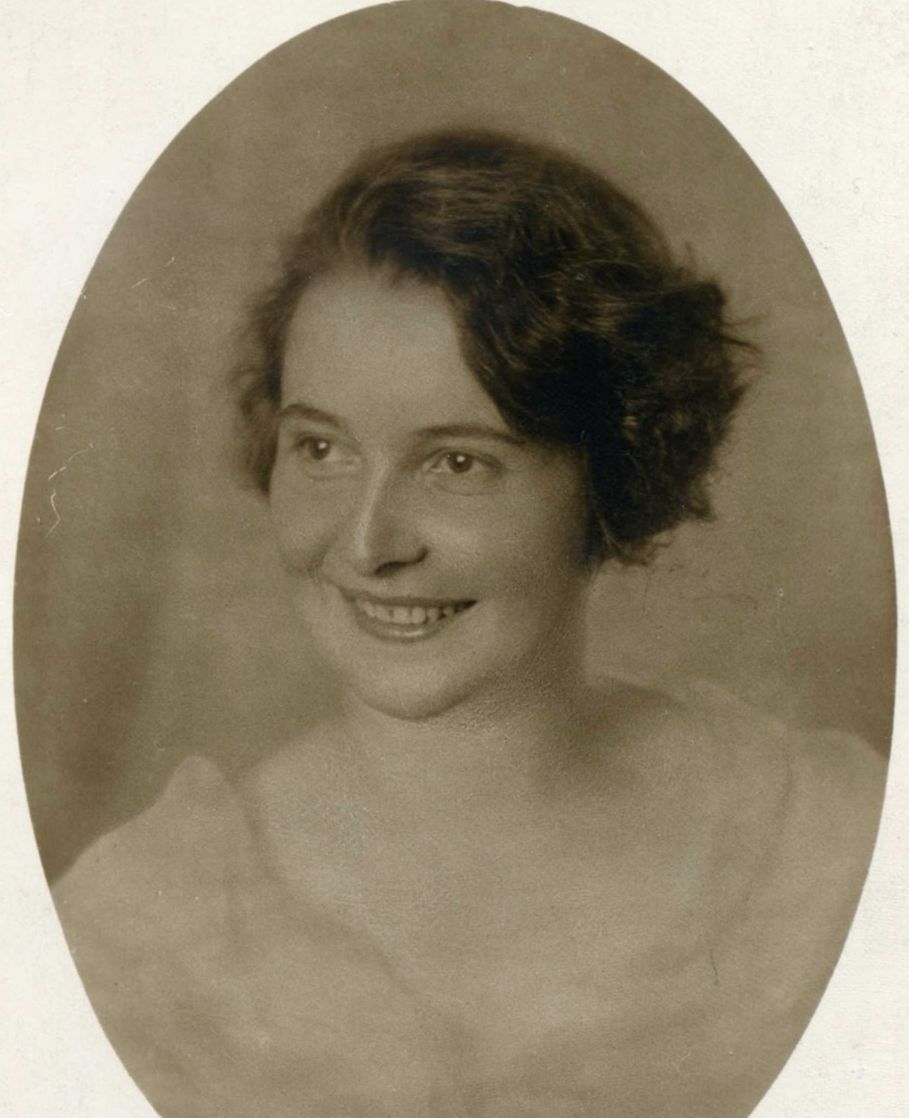
Az ő felesége Róza volt, aki törökbálinti családba született; dédapám itt ismerte meg mikor épp Budapesten dolgozott az I. világháború utáni kötelező katonai leszerelés keretében, mint állami alkalmazott. Dédanyámnak, Rózának összesen hat édes és négy féltestvére volt. Apukája, vagyis a másik ükapám János volt, aki Csehszlovákiából települt be és mészárosként dolgozott. A századfordulós fotók tanúsága szerint jómódban éltek, de a család története később szomorú fordulatokat vett. Első felesége, Franciska belehalt a hetedik gyermek megszülésébe és az I. világháború utáni gazdasági válság borzalmas szegénységhez és tragédiák sorához vezetett. János két feleségétől származó 11 gyerekéből, összesen három élte meg a felnőttkort, míg a többi TBC áldozata lett.</p>

<p><img src="/assets/images/family_pics/maria.jpg" alt="image-left" class="align-right avatar" /> Mária nevű lánya gyerekeiből több is - a korabeli belga gyermekmentő program keretein belül - Belgiumba került, hogy elkerüljék az éhezést, de pár hónap helyett már örökre ott maradtak. Az ő elszakadt és máig Belgiumban élő családfa águkkal a kapcsolatot, apukám genetikai vizsgálata élesztette fel, mely segített nekik ránk találni.</p>

<p><img src="/assets/images/family_pics/viktor_lajos.jpg" alt="image-left" class="align-left avatar" /> Ahogy említettem, dédapám, Viktor Lajos több városban élt és dolgozott míg végül pályázaton elnyerte Fekete Víz Ármentesítő Társulat igazgatói posztját Pécsett, így ott telepedtek le. Később telket vett Balatonkenesén, de ezt felajánlotta a hadiárvák nyaraltatására a Balaton Társaságnak, a fiai - Viktor és Lackó - egyetemi taníttatása finanszírozásának fejében.</p>

<p><img src="/assets/images/family_pics/laci_bacsi.jpg" alt="image-left" class="align-right avatar" /> 
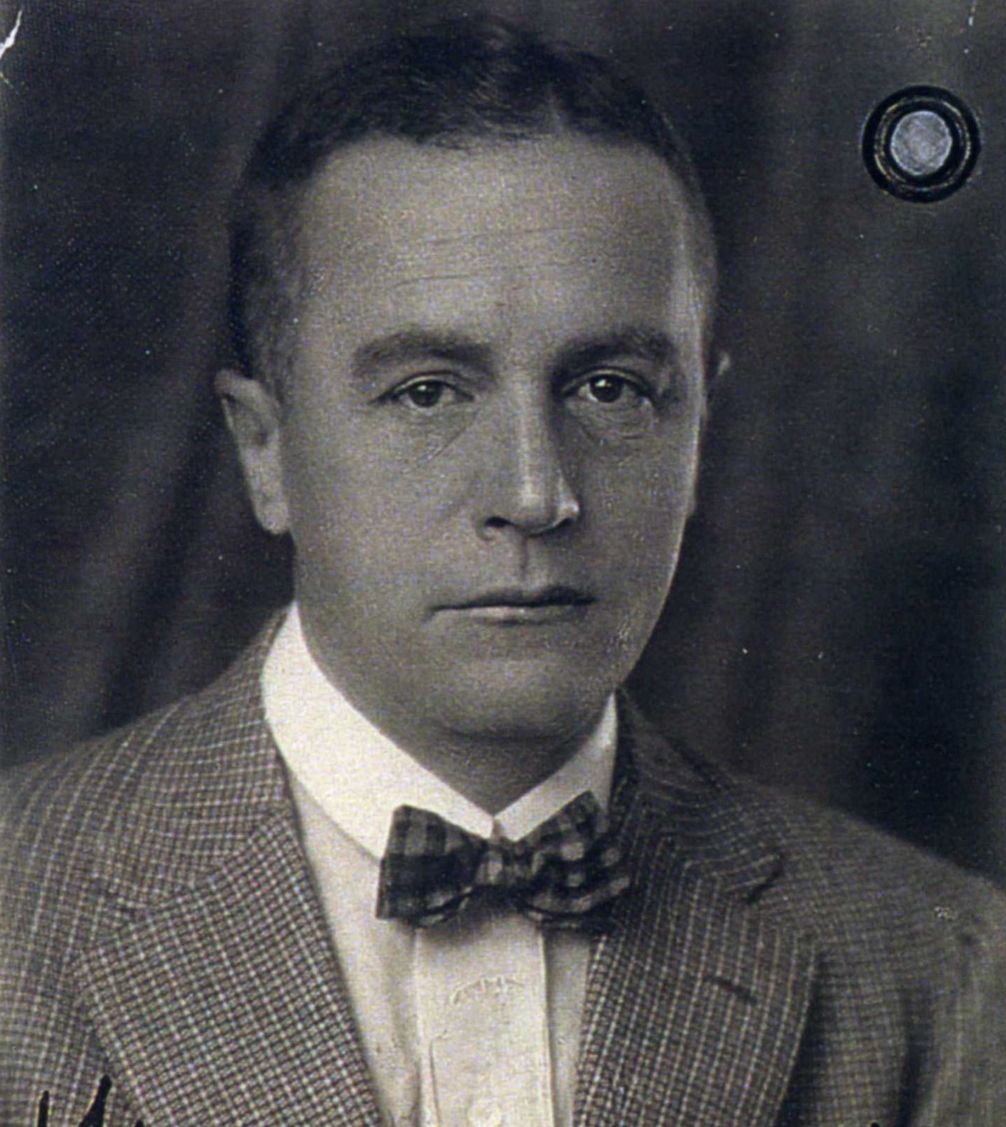
Mikor a II. világháború után, nagypapám, Viktor (nekem csak Vikó) Budapestre jött mérnöknek tanulni, a nagybátyjához, tehát Viktor Lajos bátyjához, Lacihoz költözött, a Déli pályaudvarra néző lakásába. Laci bácsi jogot végzett és táblabíróként dolgozott. A Rákosi rendszerben, a pozíciója miatti kitelepítéstől rettegett egyfolytában - nem ok nélkül, mert több barátjával is ez történt. Ez a folyamatos félelem és stressz egészen a szívrohamig hajszolta szegényt. Felesége egy nappal rá öngyilkos lett: egyszerűen a sütőbe tette a fejét és kinyitotta a gázcsapot. A náluk lakó, még egyetemista nagypapám találta meg őket, aki csodával határos módon nem csöngetett és a lakás így nem robbant fel.  A családunk sírjai amiatt vannak ma a Farkasréti temetőben, mert Vikó ott talált helyet nekik a lakáshoz közel.</p>

<p>Nagybátyja és neje halála után, nagyapám “kiigényelte” a lakás egy részét a Tanácsnál, amit az egyetemen végzett demonstrátori munkája miatt ki is utaltak neki. Az apró lakást később a Tanácson felosztották hármas társbérletre. Apukám és két öccse is itt született és kettő másik családdal osztozva egy ideig itt is éltek. Sőt, mikor ‘56-ban az oroszok lőtték a házat (mert annak tetején felkelők géppuskafészke volt), a házba bejőve egy gránátot is dobtak az óvóhelyre, ahol nagypapám, nagymamám és az akkor még csecsemő apukám rejtőzködtek. Életüket annak köszönhették, hogy dupla ajtó védte szerencsére az óvóhelyet, de az orosz katona csak az elsőt nyitotta ki.</p>

<p><strong>Galéria</strong></p>

<figure class="third ">
  
    
      <a href="/assets/images/family_pics/rudolf.jpg" title="Szépapám, Rudolf">
          <img src="/assets/images/family_pics/rudolf.jpg" alt="Szépapám, Rudolf" />
      </a>


      <a href="/assets/images/family_pics/gyula.jpg" title="Ükapám, Gyula">
          <img src="/assets/images/family_pics/gyula.jpg" alt="Ükapám, Gyula" />
      </a>


      <a href="/assets/images/family_pics/gyulaek_nagybanyan.jpg" title="Gyula és családja Nagybányán">
          <img src="/assets/images/family_pics/gyulaek_nagybanyan.jpg" alt="Gyula és családja Nagybányán" />
      </a>


      <a href="/assets/images/family_pics/viktor_lajos.jpg" title="Dédapám, Viktor Lajos">
          <img src="/assets/images/family_pics/viktor_lajos.jpg" alt="Dédapám, Viktor Lajos" />
      </a>


      <a href="/assets/images/family_pics/roza.jpg" title="Dédanyám Róza">
          <img src="/assets/images/family_pics/roza.jpg" alt="Dédanyám Róza" />
      </a>


      <a href="/assets/images/family_pics/roza2.jpg" title="Róza és testvére a hentesbolt előtt">
          <img src="/assets/images/family_pics/roza2.jpg" alt="Róza és testvére a hentesbolt előtt" />
      </a>


      <a href="/assets/images/family_pics/maria.jpg" title="Mária - gyeremekeiből többet is Belgiumba menekítettek">
          <img src="/assets/images/family_pics/maria.jpg" alt="Mária - gyeremekeiből többet is Belgiumba menekítettek" />
      </a>


      <a href="/assets/images/family_pics/maria_lanya.jpg" title="Mária lányának belga gyermekmentő levele">
          <img src="/assets/images/family_pics/maria_lanya.jpg" alt="Mária lányának belga gyermekmentő levele" />
      </a>


      <a href="/assets/images/family_pics/torokbalint_csalad.jpg" title="Ükapám, János és második felesége, 11 gyerekükkel Törökbálinton">
          <img src="/assets/images/family_pics/torokbalint_csalad.jpg" alt="Ükapám, János és második felesége, 11 gyerekükkel Törökbálinton" />
      </a>


      <a href="/assets/images/family_pics/laci_bacsi.jpg" title="Dédapám testvére Laci bácsi">
          <img src="/assets/images/family_pics/laci_bacsi.jpg" alt="Dédapám testvére Laci bácsi" />
      </a>


      <a href="/assets/images/family_pics/viktor_es_csaladja.jpg" title="Nagypapám Viktor nagymamámmal és három fiukkal">
          <img src="/assets/images/family_pics/viktor_es_csaladja.jpg" alt="Nagypapám Viktor nagymamámmal és három fiukkal" />
      </a>


</figure>

<p><strong>Összegezve:</strong> Szlovákiából elszármazott és elmagyarosodott, evangélikus mérnök-értelmiségi család az apai nagypapám ága, mely Nagyrőce, Nagybánya, Törökbálint, Debrecen, Pécs, Budapest utat bejárva kötött ki végül a magyar fővárosban. Laci bácsinak és feleségének tragikus halála egyértelműen a kommunizmus rovására írható.</p>

<h1 id="apai-nagymamám-ága">Apai nagymamám ága</h1>

<p>Szépapám dédapja, Vencel még 1735-ben Prágában született, de meghalni már Pécsett halt meg. Nem tudjuk hogyan és miért települt át, de vélhetően német ajkú lehetett a család. Öt fia született, kikből az én felmenőm, szépapám nagyapja, József  a 19. század első felében a pécsi székeskáptalan számvevője volt.</p>

<p><img src="/assets/images/family_pics/granasztoi_jozsef.jpg" alt="image-left" class="align-left avatar" /> 
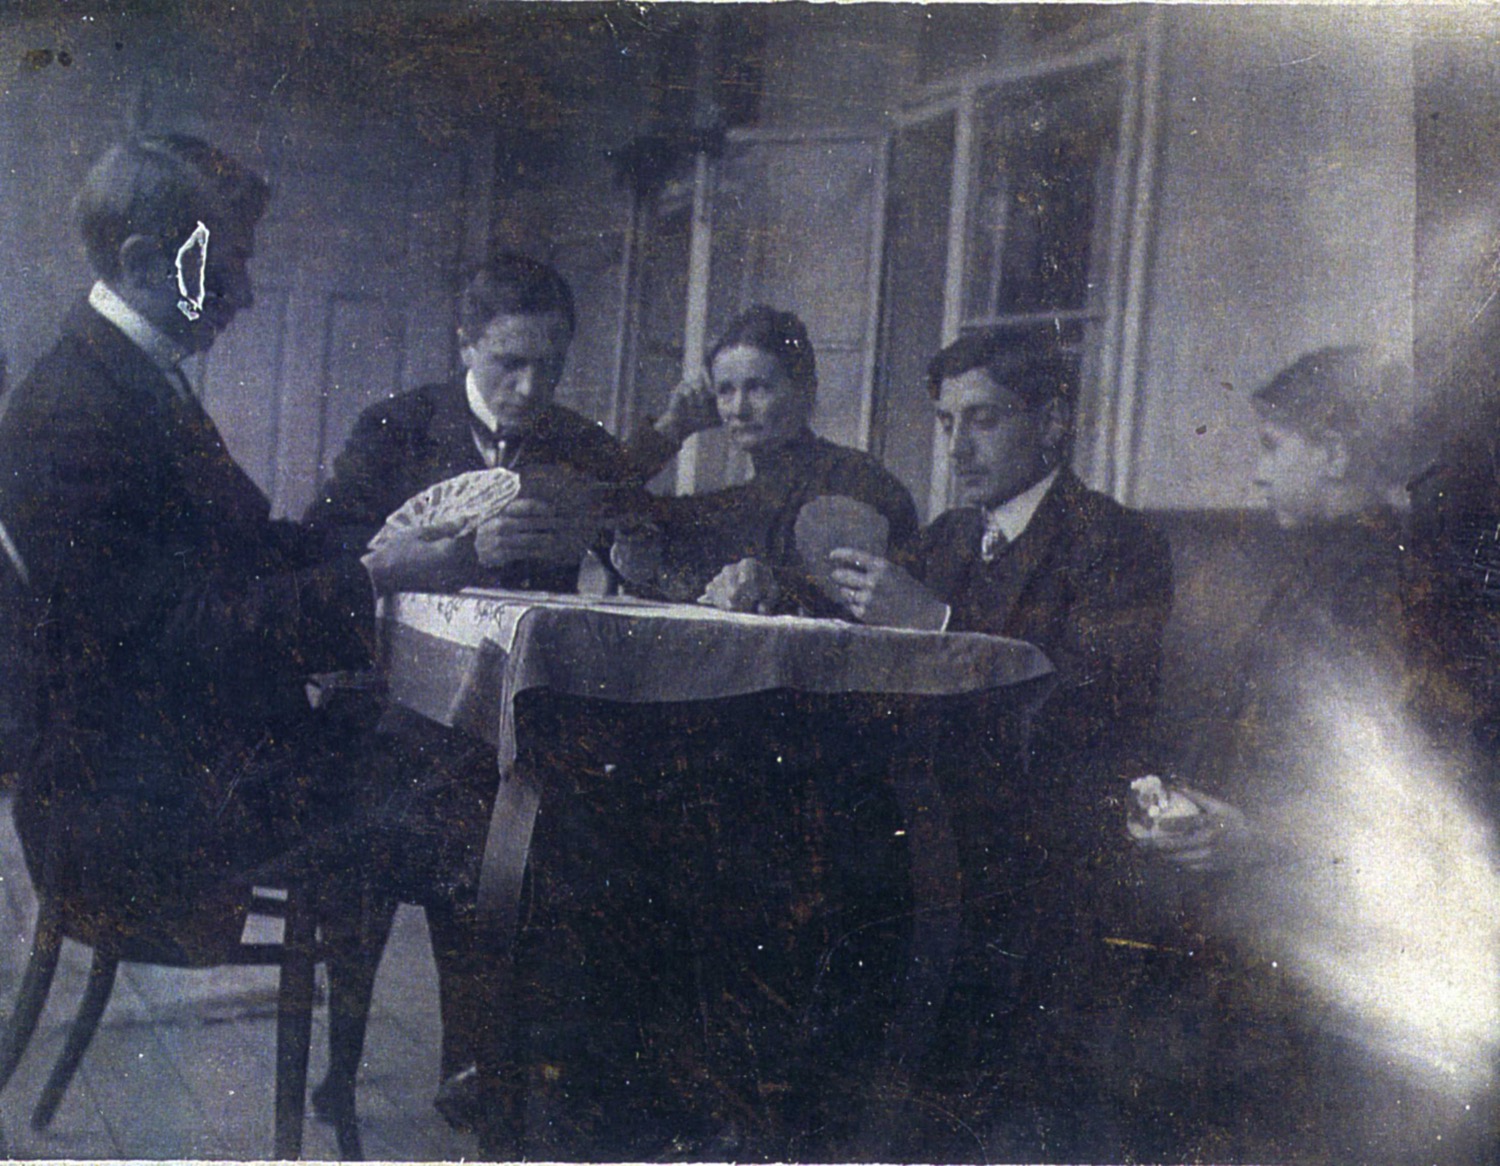
Később I. Ferenc királytól 1828. április 11.-én kapott nemesi levéllel somogybabodi földbirtokos, kisnemes lett, Granasztói előnévvel. A címer korabeli leírásából rekreált változata a mai napig megvan apukámnak. A nemeslevelet 1950 júliusában az Államvédelmi Hatóság elkobozta.</p>

<p><img src="/assets/images/family_pics/kalman.jpg" alt="image-left" class="align-right avatar" /> 
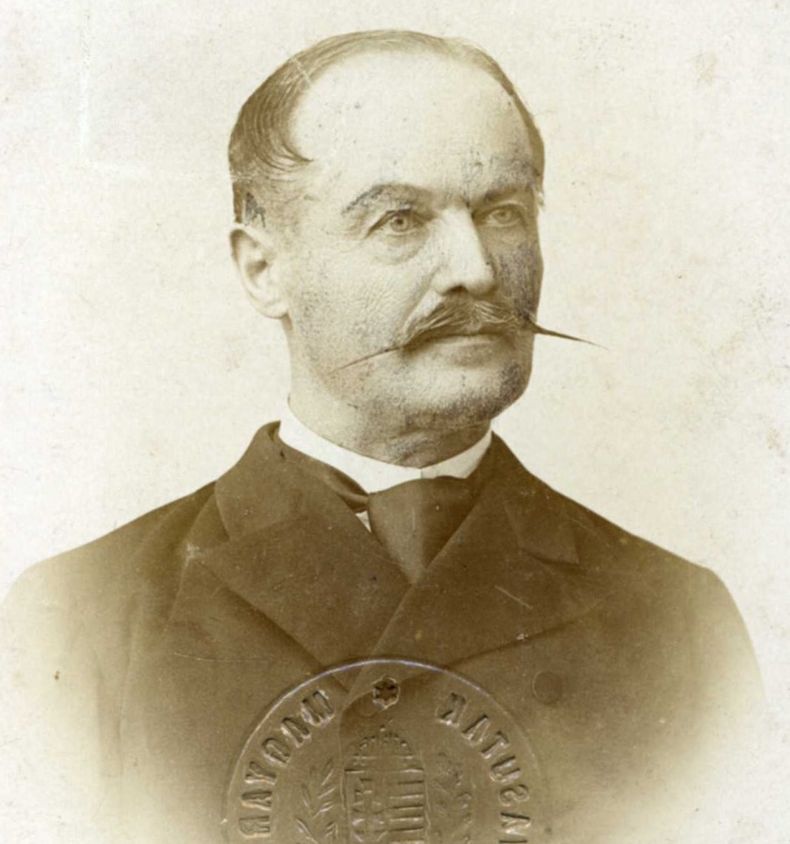
A Józsefet követő három generáció lassan levedlette földesúri életmódját és jogi végzettségére támaszkodva elpolgárosodott. A 900 hektáros birtokot szépapám, Kálmán 1890 körül a Magyar Tudományos Akadémiának eladta és beköltöztek Pécsre. Itt ők is és a következő generációk is mint különböző bírók, a közigazgatásban dolgoztak és jómódú polgári életet éltek.</p>

<p><img src="/assets/images/family_pics/laci_bacsi2_2.jpg" alt="image-left" class="align-left avatar" /> Dédapám - aki szintén Laci bácsiként fut a családi legendáriumban - Pécsett született, de ő a jogi végzettsége mellé, Sopronból bányamérnöki diplomát is szerzett. Az I. világháború utáni soproni népszavazáskor ő és egyetemista társai naponta többször szavaztak, a temetőben fellelt nevek alapján, hogy Sopron magyar város legyen. Mint tudjuk, ez sikerült.</p>

<p>Az egyetem után bányamérnökként dolgozott amikor 1928-ban a Gőzhajózási Társaság munkásai egy mammut tetemre találtak a fehérhegyi homokbányában. Ennek feltárását, rekonstruálását és konzerválását is ő vezette és a csontvázból megmaradt legimpozánsabb részek, az agyarok a <a href="https://www.jpm.hu/blog/2020-05-07-a-pecsi-mamut-jobb-oldali-agyara-egy-muzeumi-preparatum-tortenete">mai napig ki vannak állítva</a>.</p>

<p>Ezután a II. világháborúban szolgált, majd Pécsre visszatérve bányakapitány helyettesként dolgozott. 1950-ben egy bányabalesetet vartak a nyakába és koncepciós per áldozataként, ártatlanul 10 év börtönre ítélték. Szerencsére három év után kiszabadult. A börtönben átélt fizikai és lelki traumákról és megaláztatásról 23 évig nem beszélt senkinek. Azokat, 1976-ban egy 32 oldalas visszaemlékezésben adta ki magából. Az ügyről ma külön emléktábla emlékezik meg Pécsett. Míg dédapám börtönben volt, a családot a legnagyobb lánya vagyis a nagymamám Mária kellett hogy eltartsa. Emiatt neki ott kellett hagynia az iskoláját és 16 éves korában elment dolgozni a Pécsi Villanyszerelő Vállalathoz, de innen kirúgták, amikor nyilvánosságot kapott édesapja pere. Ezt követően a Gyermekélelmezési Vállalatnál kapott munkát titkárnőként. Később Budapesten is volt főnöke mellett dolgozott aki ekkor már a vállalat vezérigazgatója volt.</p>

<p><strong>Galéria</strong></p>

<figure class="third ">
  
    
      <a href="/assets/images/family_pics/granasztoi_jozsef.jpg" title="Szépapám nagyapja, Granasztói Jozsef">
          <img src="/assets/images/family_pics/granasztoi_jozsef.jpg" alt="Szépapám nagyapja, Granasztói Jozsef" />
      </a>


      <a href="/assets/images/family_pics/kalman.jpg" title="Szépapám, Kálmán">
          <img src="/assets/images/family_pics/kalman.jpg" alt="Szépapám, Kálmán" />
      </a>


      <a href="/assets/images/family_pics/laci_bacsi2_2.jpg" title="Dédapám, Laci feleségével és négyből kettő lányával">
          <img src="/assets/images/family_pics/laci_bacsi2_2.jpg" alt="Dédapám, Laci feleségével és négyből kettő lányával" />
      </a>


      <a href="/assets/images/family_pics/laci_bacsi2.jpg" title="Emléktábla Pécsett amit a koncepciós per áldozatainak állítottak">
          <img src="/assets/images/family_pics/laci_bacsi2.jpg" alt="Emléktábla Pécsett amit a koncepciós per áldozatainak állítottak" />
      </a>


      <a href="/assets/images/family_pics/laci_bacsi2_3.png" title="Dédapámék kísérleti szobája ahol a különféle konzerváló anyagokkal tesztek az exhumált részek megóvására.">
          <img src="/assets/images/family_pics/laci_bacsi2_3.png" alt="Dédapámék kísérleti szobája ahol a különféle konzerváló anyagokkal tesztek az exhumált részek megóvására." />
      </a>


</figure>

<p><strong>Összegezve:</strong> Prága környékéről már az 1700-as évek közepén áttelepült, feltehetően eredetileg német ajkú majd elmagyarosodott jogász, földbirtokos-értelmiségi család az apai nagymamám ága, akik erős katolikus gyökerekkel bírtak. Bő kétszáz évig, 1770 és 1982 között Pécsett éltek. Dédapám bebörtönzése és meghurcolása, illetve nagymamám életének és tanulmányainak kisiklatása egyértelműen a kommunizmus számlájára írható.</p>

<h1 id="anyai-nagymamám-ága">Anyai nagymamám ága</h1>

<p><img src="/assets/images/family_pics/daniel.jpg" alt="image-left" class="align-left avatar" />  Ez az ága a családfának, a 19. század elejéig vezethető vissza. Nagymamám felmenői  német nevű, németül jól beszélő vajdasági svábok voltak. Dédapám, Dániel hivatásos katona, hidász volt, az I. világháborúban az olasz fronton szolgált. Szolgálatáért ki is tüntették, katonaságból végkielégitéssel nyugdíjazták amiből kávéházat és vegyeskereskedést is tudott venni Szegeden. A kávéház Szeged belvárosában, a Kölcsey utcában állt mely ma sétáló utca. Mivel nem volt egy éjszakai ember, mindenkit kirakott 9 óra után. Emiatt persze nem is volt túl népszerű a vendégek körében, így idővel el is adta a kávézót.</p>

<p>Annak ellenére, hogy kitüntetett katona volt, aki háborúban szolgálta a hazáját, és az ország egyik nagyvárosában boltot és kávéházat is üzemeltetett, a II. világháború után hamis politikai vádak alapján öt év börtönre és teljes vagyonelkobzásra ítélték. Mint megannyi német örökséggel, névvel és kulturális kötődéssel rendelkező kortársát, őt is SS tagsággal vádolta a magyar kormány. Ez azért különösen pikáns - hogy finoman fogalmazzak - mert a magyarországi német kisebbséghez tartozó magyar állampolgárok Waffen-SS-be sorozásáról a <a href="https://real.mtak.hu/172454/1/regio-2023-1-03-markus.pdf">magyar kormány egyezményt írt alá Németországgal</a>, ezzel kiszervezve az országban akár több száz éve élő német etnikumú polgárait a náci hadseregbe. Ez az eleinte önkéntes alapon zajló majd kényszersorozássá fajuló folyamat 1940-1944 közt három hullámban zajlott le egyre erőszakosabbá válva. Dédapámat - nagymamám elmondása szerint - a harmadik hullámban, teljesen a tudta nélkül léptették be az SS-be, amikor már majdnem 60 éves volt szegény. Öt fiú testéréből többen is a Waffen-SS-ben találták magukat és az orosz fronton harcoltak. Egyikük, Poldi bácsi dezertált egy zsidó munkaszolgálatossal, majd Erdélybe tért vissza ahol több mint egy évig bújkált a háza pincéjében.</p>

<p>Dédapám 63 éves korában, 2,5 év után szabadult, de ekkor a kollektív bűnösség elve alapján a család megkapta a kitelepítési végzést. Dániel szívesen ment volna, mivel eddigre már nincstelen volt, de legkisebb lánya, nagymamám, Liza fellebbezett a Belügyben és ennek hatására törölték a végzést. A család maradhatott. Nem úgy mint 185 ezer társuk, akik sokszor több generációnyi, vagy akár több évszázadnyi magyarországi élet után váltak nincstelenné és száműzötté, hogy házaikat, boltjaikat és földjeiket sokszor a saját szomszédaik, az “igazi” magyarok “vegyék át”.</p>

<p>Az élet fura fintora, hogy mikor Budapesten vagyunk családot látogatni, akkor Budaörsön lakunk egy társasházban, ami egy volt sváb ház helyén épült. Ennek egykori tulajdonosai talán épp olyan svábok lehetettek mint a dédapám. Csak ők nem maradhattak a helyükön szerencsétlenek, hanem brutális körülmények közt deportálák őket úgy ahogy pár száz évvel korábban az őseik érkeztek a Dunán: nincstelenül, a semmibe. Érdekesség, hogy a Budaörsről és környékéről kitelepített- és megmaradt - svábok történeteit, kultúráját és emlékét, a lakásunktól csak egy utcányira lévő <a href="https://heimatmuseum.hu/de/home-page-de-03/">Jacob Bleyer Heimatmuseum</a> őrzi és ápolja.</p>

<p><img src="/assets/images/family_pics/berti_liza.jpg" alt="image-left" class="align-right avatar" /> <strong>Összegezve:</strong> anyai nagymamám ága német eredetű sváb család akik több száz éve éltek az ország déli részén. Annak ellenére, hogy az I. világháborúban az országért harcolt, majd köztiszteletben álló polgárként élt, dédapámat hamis vádakkal mégis meghurcolták és kitelepítették (volna) családjával együtt.</p>

<p>Ez azonban nagymamámnak köszönhetően nem történt meg, aki így találkozni tudott nagypapámmal.</p>

<p><strong>Galéria</strong></p>

<figure class="third ">
  
    
      <a href="/assets/images/family_pics/daniel.jpg" title="Dédapám, Dániel">
          <img src="/assets/images/family_pics/daniel.jpg" alt="Dédapám, Dániel" />
      </a>


      <a href="/assets/images/family_pics/daniel2.jpg" title="Dédapámék családja, háttérben testvérei katona egyenruhában">
          <img src="/assets/images/family_pics/daniel2.jpg" alt="Dédapámék családja, háttérben testvérei katona egyenruhában" />
      </a>


      <a href="/assets/images/family_pics/berti_liza.jpg" title="Nagyszüleim, Berti és Liza">
          <img src="/assets/images/family_pics/berti_liza.jpg" alt="Nagyszüleim, Berti és Liza" />
      </a>


</figure>

<h1 id="anyai-nagypapám-ága">Anyai nagypapám ága</h1>

<p><img src="/assets/images/family_pics/albert.jpg" alt="image-left" class="align-left avatar" /> 
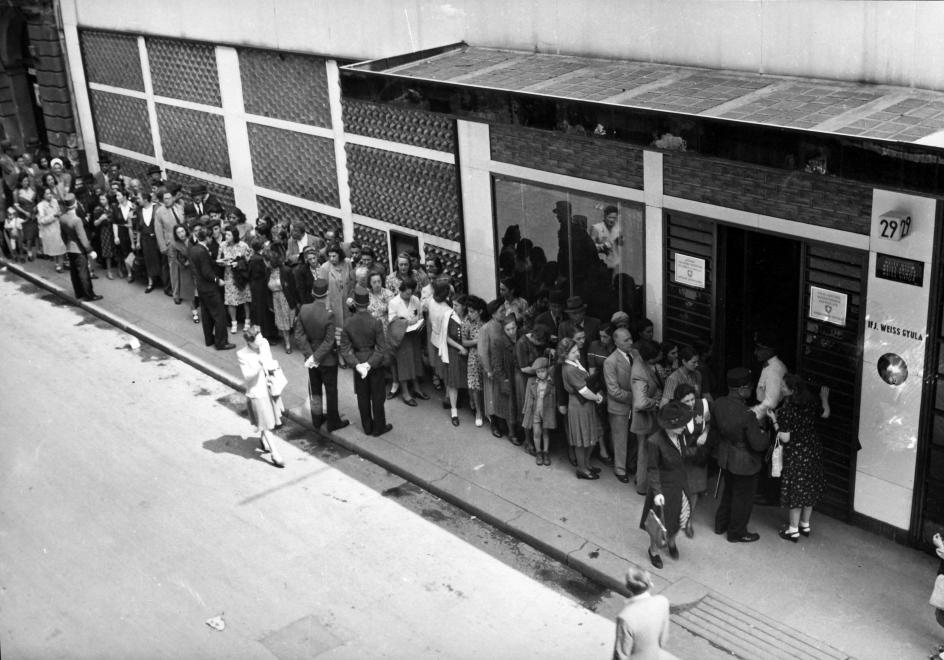
Szépapám, ükapám és dédapám is mind zsidó kereskedők és borkeresdők voltak. A család pár generáció alatt Gyónról (Dabas), Szolnokot érintve Budapesten kötött ki, ahol nagypapám, Albert (nekem Berti) is született. Ő 14 éves volt 1944-ben. Visszaemlékezését a nagymamám jegyezte le a háború után évtizedekkel, ebből tudjuk az alábbi részleteket:</p>

<p>A német megszállást követően, csillagot kellett viselniük, és a VIII. kerület József utcai lakásukat elhagyni - oda egy nyilas házaspár költözött be. A Kertész és Dob utca sarkán lévő csillagos házba költöztek, ahova csak személyes ruházatukat vihették. Ez a lakás Dr. Klug Lipót – eredetileg kolozsvári – egyetemi professzoré volt. A lakást tulajdonosának köszönhetően mentelmi jog védte. Klug Lipót házvezetőnője volt Berti nagynénje, akit Klug révén szintén mentelmi jog illetett. A csillagos házba költözést követően már sem dolgozni, sem iskolai tanulmányokat folytatni nem lehetett. Az 1944. Október. 16.-ai nyilas hatalomátvételt követően német SS-ek és a magyar nyilasok mind a négyüket (nagypapám, két nővére és anyukája) leterelték a ház pincéjébe és valamennyi holmijukat testi motozással elkobozták. Ugyanezen a napon, dédapám megszökve a délvidéki munkaszolgálatból rájuk talált a pincében.</p>

<p><img src="/assets/images/family_pics/schwarzek.jpg" alt="image-left" class="align-center" /></p>

<p>Még ugyanaznap este 10 óra körül az SS és nyilas különítményesek kizavarták őket ismét a házból. A Dob utcán ötös sorokba állították őket és újabb testi motozással a még nálunk lévő tárgyakat is elvették, mondván: „Maguknak erre már úgy sincs szükségük”. Elterjedt a hír, hogy a Duna partra viszik őket kivégzésre. A sorok mögött egy Tigris tank állt. A környező utcákból és a Klauzál térről hasonlóan össze tereltekkel együtt több ezren voltak. Közben megjelent valaki – utóbb feltételezés szerint ez Wallenberg volt – aki tárgyalni kezdett a különítményesekkel és ezt követően nem a Duna partra, hanem a Kazinczy utcai zsinagógába tereltek őket. Itt négy napon keresztül minden fajta élelmezés nélkül senyvedtek. Négy nap után magyar rendőrök nyitották ki a zsinagógát és felszólítottak őket: nagyon csendben menjen mindenki vissza a korábbi csillagos házába.</p>

<p>A történet innen további elképesztő fordulatokkal folytatódik. Habár eddigre már munkaszolgálatra vitték nagypapám nővéreit és apukáját is az óbudai téglagyárba, ő a Vadász utcai “Üvegház” előtt sorban állva menlevelet tudott szerezni mindannyiuknak. Itt működött a Svájci Követség Idegen Érdekek Képviseletének Kivándorlási Osztálya. Ez nem volt más mint egy elképesztő léptékű zsidó mentő akció amit Carl Lutz korabeli svájci konzul szervezett és aminek keretén belül több mint 50 ezer engedély nélkül kiállított menlevelet adtak ki, melyek Palesztinába való kivándorlásra jogosították a birtokost. Továbbá, a program keretein belül üzemelt Svájc 76 védett háza is, melyek a menlevelek tulajdonosainak valamiféle átmeneti védelmet nyújtottak. Ezek egyikébe, a Pozsonyi út 16 számba költöztek nagypapámék végül, mire mindenki meg tudott szökni a téglagyári munkaszolgálatból. A svéd Wallenberg akciójához mérhető svájci menlevél program dokumentáltan több ezer családot mentett meg, még akkor is, ha a nyilasok rendszeresen razziáztak és hurcoltak el embereket kivégezni a védett házakból is.</p>

<p>Így történt ez nagypapám nővéreivel és anyukájával is akiket a nyilasok a Duna partra hurcoltak agyonlőni. Ezúttal nagypapámat túl fiatalnak, apukáját túl idősnek nyilvánították a nyilasok, így ők maradhattak. A lányok és dédanyám hihetetlen szerencséjére egy szovjet Rata alacsonyan repülve a Szent István Park felett megrémítette a transzportot kísérő nyilasokat és azok szétszaladtak. Ezt a helyzetet kihasználva a csoport is felbomlott és visszamenekültek a védett házba. Már Január közepe volt, Budapest ostromának egyik legintenzívebb szakasza, mikor a nyilasok ismét razziáztak és a Dob utcai gettóba vitték át az egész családot. Január 18-án aztán észrevették, hogy szovjet katonák jelentek meg az utcán. Hosszú évek óta először, ekkor tudtak fellélegezni. Csodával határos módon, az egész család megmenekült.</p>

<p>Dédapám testvérének, Margitéknak és családjának nem volt ilyen szerencséje. Őket deportálták és Auswitzban haltak meg. Ahogy történt ez majdnem 600 ezer zsidó honfitársunkkal, akiket a magyar államhatalom a Holokauszt történetében páratlan - még a németeket is meglepő - hatékonysággal és kegyetlenséggel küldött a halálba. A fővárosi zsidóság kevesebb mint fele élte túl a Holokausztot, de ez még istenes ahhoz képest ami a vidéki zsidósággal történt. A trianoni országterületen 1939-ben 704 zsidó hitközség létezett, 1946-ban 263. A következő években az elvándorlás, az állami nyomás és a tradicionális életforma felbomlása miatt számuk fokozatosan csökkent. Kárpátalján a háború előtt mintegy 400 hitközség működött, 1946-ban húsz, 1950-ben már csak négy.</p>

<p><strong>Galéria</strong></p>

<figure class="third ">
  
    
      <a href="/assets/images/family_pics/albert.jpg" title="Ükapám, Albert">
          <img src="/assets/images/family_pics/albert.jpg" alt="Ükapám, Albert" />
      </a>


      <a href="/assets/images/family_pics/schwarzek.jpg" title="Schwarz család, nagypapámmal középen">
          <img src="/assets/images/family_pics/schwarzek.jpg" alt="Schwarz család, nagypapámmal középen" />
      </a>


      <a href="/assets/images/family_pics/uveghaz.jpg" title="Üvegház előtt menlevélért sorban álló budapesti zsidók">
          <img src="/assets/images/family_pics/uveghaz.jpg" alt="Üvegház előtt menlevélért sorban álló budapesti zsidók" />
      </a>


      <a href="/assets/images/family_pics/carl_lutz.jpg" title="Carl Lutz korabeli svájci konzul, a svájci menlevél program főszervezője, több ezer zsidó család és így az én nagypapám megmentője.">
          <img src="/assets/images/family_pics/carl_lutz.jpg" alt="Carl Lutz korabeli svájci konzul, a svájci menlevél program főszervezője, több ezer zsidó család és így az én nagypapám megmentője." />
      </a>


      <a href="/assets/images/family_pics/raoul_wallenberg.jpg" title="Raoul Wallenberg, svéd építész, üzletember, diplomata akinek több ezer magyar zsidó család köszönheti az életét.">
          <img src="/assets/images/family_pics/raoul_wallenberg.jpg" alt="Raoul Wallenberg, svéd építész, üzletember, diplomata akinek több ezer magyar zsidó család köszönheti az életét." />
      </a>


</figure>

<p><strong>Összegezve:</strong> anyai nagypapám ága zsidó kereskedő család, melyet csak részlegesen sikerült kiírtani, hála a svájci nagykövetség mentő akciójának és a svéd Wallenbergnek. Érthető okokból, dédapám a Holocaust túlélését követően, Schwartz családnevét - melyet generációk óta vitt a család - magyarította.</p>

<h1 id="ki-tud-itt-élni">Ki tud itt élni?</h1>

<p>Apai ágon tehát szlovákiából és csehországból betelepült családokat látunk amik generációk óta éltek, sőt prosperáltak Magyarországon, értelmiségi, polgári életet élve. Őket egymástól függetlenül, komoly trauma érte a kommunista időkben.</p>

<p>Ezzel szemben, anyai ágon egy katonai teljesítményéért kitüntett ám később mégis börtönre és kitelepítésre kárhoztatott, több generáció óta itt elő svábot, és egy félig kiirtott zsidó kereskedő családot  találunk.</p>

<p>Felmerül hát a kérdés az emberben, hogy mégis ki az aki tud ebben az országban háborítatlanul élni? A fentiekből úgy tűnik, hogy élhet itt az ember több száz éve és lehet ő</p>

<ul>
  <li>katolikus, evangélikus vagy zsidó,</li>
  <li>mérnök, jogász, katona vagy kereskedő,</li>
</ul>

<p>de Magyarország tartogat kisebb “meglepetéseket” számára.</p>

<p>Hetek óta gondolkodtam, hogy mi a közös ezekben a sorsokban. Éreztem, hogy valami összeköti ezeket a történeteket, de nem tudtam pontosan megfogalmazni micsoda. Míg nem egy reggel az ágyban fekve beugrott: azért nem tudok rá szót találni, mert nincs. Így kreáltam egyet: “polgár-árulás”, vagyis a hazaárulás szöges ellentéte.</p>

<p class="text-center"><strong>Felmenőim nem a hazájukat árulták el,<br /> hanem a hazájuk árulta el őket.</strong></p>

<p>Kivétel nélkül. Mindannyiukat. Több generációnyi tevékeny és lelkes kontribúció után, függetlenül attól, hogy hol éltek, kiben hittek, és mivel foglalkoztak, ez az ország egyszer úgy döntött, hogy kisemmizi őket vagy akár szabályosan megszabadul tőlük.</p>

<p>Mikor ezt végre tisztán láttam és kimondtam, akkor majdnem húsz évnyi feszültség és útkeresés zárult le bennem. Katartikus módon, de mégis mindenféle harag és érzelem nélkül, pusztán egy nagyot sóhajtva érkeztem meg a Magyarországhoz fűződő kapcsolatom lezárásához.</p>

<h1 id="utószó">Utószó</h1>

<p>Joggal merülhet fel az olvasóban, hogy valószínűleg ugyanilyen sors várt volna a elődeimre Lengyelországban, Csehszlovákiában vagy Romániában is. Ha így van, Magyarország nem unikális és felmenőim zavarba ejtően egybehangzó történetei, pusztán a vérzivataros 20. századdal és az ország geográfiai elhelyezkedésével magyarázhatóak. Bár kizárni nem tudom,  kétlem hogy így lenne és ami a fontosabb, hogy számomra a történet végkicsengésén nem változtatna se pro, se kontra.</p>

<p>Viszont ami változtatni tudott volna - az elmúlt 15 év borzalmas politikájának elkerülésén túl -  az  az, ha nem érezné az ember lépten nyomon, hogy ez az állam és ez az ország képes lenne szinte bármikor ismét elárulni a polgárait ahogy a felmenőimmel tette. De ezt nem hogy nem érzem, attól tartok, közelebb vagyunk ma ehhez, mint voltunk 30 éve.  Nem tudom, hogy ez miért van így, de sejtem, hogy az alábbi beidegződések erősen hozzájárulnak.</p>

<p>A kevés - és mély tiszteletet érdemlő - kivételtől eltekintve, a legtöbb nemzet imádja magától eltolni a történelmi felelősséget és szembenézni vitatható múltbéli tetteivel. Vagy ha számot is vet, azt gyakran megkésve, nem megfelelően bocsánatot kérve és relativizálva teszi. Igaz ez Nagy-Britanniától, Franciaországon át Belgiumig egy sor országra. De a magyar történelmi emlékezet még ezen is túltesz sajnos és számos szégyenletes történelmi ténnyel nem hogy nem néz szembe, de egyenesen áldozati narratívában meséli el az ország szerepét, ami egészen perverz helyzeteket szül.</p>

<p>Ez történik mikor Magyarország szerepét - amit a zsidóság <a href="https://www.wikiwand.com/hu/articles/Zsid%C3%B3_holokauszt_Magyarorsz%C3%A1gon#A_holokauszt_el%C5%91zm%C3%A9nyei_a_magyar_t%C3%B6rv%C3%A9nyhoz%C3%A1sban">szisztematikus és évtizedekig tartó ellehetetlenítésében</a> és 70%-ának elpusztításában vállalt - kicsinyíti, relativizálja, sőt a náci megszállás okán szinte lényegtelenné nyilvánítja. Ez a végletekig cinikus és önreflexióra képtelen történelmi emlékezet sejlik fel az olyan népi legendák mögött, mint hogy Horthy zsidó mentő lett volna - <a href="https://atlatszo.hu/kult/2020/06/11/horthy-miklos-egyertelmuen-felelos-volt-a-feherterrorert-es-a-zsidok-deportalasert-is/">ami hazugság</a> -, vagy a <a href="https://www.wikiwand.com/hu/articles/A_n%C3%A9met_megsz%C3%A1ll%C3%A1s_%C3%A1ldozatainak_eml%C3%A9km%C5%B1ve">német megszállás áldozataira emlékezni kívánó minősíthetetlen giccs halmazban</a>, ami egészen groteszk módon, Magyarországot szó szerint egy angyalnak ábrázolja, amit a gonosz német sas elrabol. Ezekkel a romanticizált hazugságokkal szemben, a valóság jóval <a href="https://www.youtube.com/watch?v=_BUKzVgtuos">velőtrázóbb</a> és <a href="https://www.youtube.com/watch?v=4ygZB1MTRR4">kijózanítóbb</a> képet mutat Magyarország kormányáról és a magyar lakosság szerepéről.</p>

<p>De ugyanezt teszi a magyar történelmi emlékezet, mikor a németek erőszakos kitelepítésének feldolgozásáról van szó. Ilyenkor szokás ugyanis a jól bevált áldozati panelek aduászát, a potsdami konferenciát felemlegetni és azt mondani, hogy valójában, a 185 ezer német kisebbséghez tartozó magyar állampolgárnak az erőszakos kitelepítése, pusztán a győztes hatalmak kérésére történt. Ez azonban, <a href="https://youtu.be/CgkCad25Pjw?t=3352">egészen egyszerűen nem igaz</a>.</p>

<p>És hát mit mondhatunk a kommunista múltal való szembenézésről, egy olyan országban, ahol a mai napig nem sikerült nyilvánosságra hozni az ügynökaktákat? Ahol az összesen már 20 éve miniszterelnök pártja - bár bőszen nacionalista és anti-kommunista, miközben egyszerre orosz barát is - több MSZMP tagot, III/II-es, sőt III/III-as ügynököt tartalmaz, akár a mai napig magas kormányzati pozíciókban.</p>

<p>Vagy hogyan értelmezhető az, hogy a mai magyar kormány magát áldozatként beállítva sipákol az őt ért “sérelmek” miatt, miközben az egyik szomszédját - ahol mellesleg magyarok is élnek szép számban - naponta bombázzák három éve? Ezek és egy sor más történelmi példa mind azt mutatják, hogy a történelmi önreflexióra való képesség több száz éves deficitben van Magyarországon. Helyette pedig sokszor egy - a történelmi tényekkel össze nem egyeztethető - áldozati narratíva a domináns reflex ami meghatározza Magyarország történelmi önképét.</p>

<p>Százszor leírt közhely, hogy ha egy országban nem történik meg a történelmi bűnökkel való szembenézés egy kritikus tömeg által, akkor az a nép nem is képes tanulni semmit a történtekből. Ez pedig nyilvánvalóan termékeny talaja a következő tragédiáknak.</p>

<p>Csak remélni tudom, hogy egy újabb generáció elteltével javulnak majd ezek a reflexek Magyarországon, de nem vennék rá mérget, hogy így lesz. Az a baj, hogy ha valami 1000 éves, az bár jól mutat egy turisztikai brosúrán, de egyben erősen kétélű fegyver is. Ugyanis 1000 éves dolgok ritkán szoktak megváltozni és főleg megújulni.</p>]]></content><author><name>danielhomola</name></author><category term="M &amp; E" /><category term="history" /><category term="hungary" /><category term="history" /><category term="family" /><summary type="html"><![CDATA[Négy család története és sorsa, melyek bár különbözőek, ugyanúgy átszövik Magyarország évszázadait és fájdalmasan hasonlóan végződnek.]]></summary></entry><entry><title type="html">What have the Hungarians given us?</title><link href="https://danielhomola.com/m%20&%20e/history/what-have-the-hungarians-given-us/" rel="alternate" type="text/html" title="What have the Hungarians given us?" /><published>2025-09-06T00:00:00+02:00</published><updated>2025-09-06T00:00:00+02:00</updated><id>https://danielhomola.com/m%20&amp;%20e/history/what-have-the-hungarians-given-us</id><content type="html" xml:base="https://danielhomola.com/m%20&amp;%20e/history/what-have-the-hungarians-given-us/"><![CDATA[<blockquote class="notice--primary">
  <p>This is post is part of my <a href="/m%20&amp;%20e/letters-to-m-and-e/"><strong>Letters to M &amp; E</strong></a> series.</p>
</blockquote>

<blockquote class="notice--warning">
  <p>Ez az angol fordítás. <a href="/m%20&amp;%20e/history/mit-adtak-nekunk-a-magyarok/"><strong>Az erdeti magyar verzió itt olvasható.</strong></a></p>
</blockquote>

<h1 id="foreword">Foreword</h1>

<p>One of the funniest scenes from the eternal classic “Life of Brian” is when a group of enraged Jews are scheming about how they’re going to kidnap Pilate’s wife to give force to their independence demands. The community leader, after listing how the damn Romans have already exploited their fathers (and their fathers’ fathers, and even their fathers’ fathers’ fathers), poses that provocative question - which has since become a catchphrase - “What  have the Romans ever given us?”</p>

<p>Anyone who has seen it surely remembers that instead of the expected rage-filled answers like “Absolutely nothing, the bloody bastards!”, unexpected responses start pouring from the group of plotters: “aqueducts”, “sanitation”, “roads”, “irrigation”, “medicine”, “education”, “wine”, “public safety” and in the end it turns out that the Romans “brought peace” too. I honestly envy anyone who hasn’t seen it yet and can watch it for the first time, here’s the <a href="https://www.youtube.com/watch?v=Qc7HmhrgTuQ">link</a> to the scene.</p>

<p>It’s been almost 9 years since I wrote my previous <a href="https://medium.com/@dani.homola/ki-bev%C3%A1ndorl%C3%B3-913ce21d725f">“Emigrant/Immigrant”</a> post. I wrote that on the fifth anniversary of our emigration to London and it was a reflection on all the things that experience has taught me. Well, after 14 years in self-inflicted exile, we still don’t live in Hungary, but we have doubled in size as a family and moved to another country. However, I’m slowly approaching forty and so I’m increasingly occupied with our family’s history, so it recently occurred to me: how would I answer, if I found myself in the above mentioned scene - but with a twist - where we’d replace Rome with Hungary. The question therefore is: “What have the  Hungarians given us?”</p>

<p>I think every Hungarian will have an answer to this strange question, one that builds on their own origins and family history. Also, it goes without saying, replacing Hungary with any other country results in an equally interesting thought exercise. Regardless of what the response sounds like to this strange question, I would honestly encourage everyone to do the intellectual and spiritual work necessary to answer the question, because it can be cathartic. It was for me.</p>

<p>Here is my, or rather our family’s answer, which for the sake of comprehensibility, I compiled from the stories of my four grandparents’ immediate families, using only first names - so as not to make the exact identity of the persons completely public.</p>

<h1 id="paternal-grandfathers-line">Paternal Grandfather’s Line</h1>

<p><img src="/assets/images/family_pics/rudolf.jpg" alt="image-left" class="align-left avatar" /> My 3rd great-grandfather, Rudolf, was the director of the first Slovak gymnasium and an protestant chaplain during the monarchy era, in what is now Slovakia - in a town called Nagyrőce.  The fact that a town had the opportunity to teach its students in Slovak was such a big deal at the time that a memorial plaque still preserves my 3rd great-grandfather’s name in the museum of Nagyrőce to this day. But to understand why, I need to provide a bit of background.</p>

<p>The <a href="https://www.wikiwand.com/en/articles/Austro-Hungarian_Compromise_of_1867">Compromise of 1867</a>  turned the Austro-Hungarian Empire into a real union between the Austrian Empire in the western and northern half and the Kingdom of Hungary in the eastern half. During this period, the Hungarian government started to force the Hungarian language onto the non-Hungarian peoples of her territories in an ever more forceful way. This was done to speed up the assimilation of the dozen or so non-Hungarian ethnic groups who all lived in the Eastern part of the wildly multi-cultural and mult-religious Austro-Hungarian Empire. In line with these chauvinistic aspirations, in the 1860s and `70s, the Hungarians closed almost all Slovak-language gymnasiums, since they considered these the antechamber for training the Slovak elite and thus the kindling for the Slovak national movement. In 1874, the gymnasium led by my 3rd great-grandfather was also closed. Nonetheless, Rudolf stayed in the town and died 24 years later.</p>

<p>An interesting side note: <a href="https://www.wikiwand.com/en/articles/Gyula_Rochlitz">Gyula Rochlitz</a> was Rudolf’s contemporary, who was also born and raised in Nagyrőce. He was an architect from a Saxon family, educated at Vienna University, who emigrated to Western Europe and then returned to Budapest, where he designed the main building of the <a href="https://www.wikiwand.com/en/articles/Budapest_Keleti_station">Eastern Railway Station in Budapest</a>.  His story shows not only the incredible ethnic and cultural diversity of the monarchy, but also the opportunities within it. End of side note.</p>

<p><img src="/assets/images/family_pics/gyula.jpg" alt="image-left" class="align-right avatar" /> My paternal great-great-grandfather, Gyula, already lived mostly in Nagybánya (in today’s Romania) and died there too. He worked as chief mining accountant. They had a house in the old-town, in Castle Street, where his two two sons and three daughters were born. His younger son, Viktor Lajos, is my great-grandfather, who as a certified engineer, after positions in a series of towns, finally settled in Pécs (city in South Hungary) and died there in his vineyard in the Mecsek hills. By this time the family had clearly become Hungarian - both in language, and presumably culturally.</p>

<p><img src="/assets/images/family_pics/roza.jpg" alt="image-left" class="align-left avatar" />Viktor Lajos’s wife, my great-grandmother was Róza, who was born into a family in Törökbálint - a town close to Budapest. They met when my great-grandad was working in the capital within the framework of the mandatory military demobilization after World War I, as a state employee. Róza had a total of six full siblings and four half-siblings. Her father, that is, my other great-great-grandfather, was János, who came from Czechoslovakia originally and worked as a butcher. According to turn-of-the-century photos, they lived in prosperity, but the family’s story later took sad turns. His first wife, Franciska, died giving birth to their seventh child, and the economic crisis after World War I led to terrible poverty and a series of tragedies. Of János’s 11 children from two wives, only three lived to adulthood, while the rest became victims of tuberculosis.</p>

<p><img src="/assets/images/family_pics/maria.jpg" alt="image-left" class="align-right avatar" /> Several of his daughter Mária’s children - within the framework of the contemporary Belgian child rescue program - ended up in Belgium to avoid starvation. However, instead of staying just a few short months, they remained forever. The connection with this separated family tree branch - still living in Belgium - was revived by my father’s genetic test, which helped them find us.</p>

<p><img src="/assets/images/family_pics/viktor_lajos.jpg" alt="image-left" class="align-left avatar" /> As I mentioned, my great-grandfather, Viktor Lajos, lived and worked in several cities until he finally became the director of the Flood Control Association in Pécs, so they settled there. He later bought a plot near Lake Balaton, but offered this to the Balaton Society for vacationing war orphans, in exchange for financing his sons’ university education.</p>

<p><img src="/assets/images/family_pics/laci_bacsi.jpg" alt="image-left" class="align-right avatar" /> When my grandfather, Viktor (to me, simply Vikó) came to Budapest to study engineering after World War II, he moved in with his uncle Laci, into his apartment overlooking the Southern Railway Station. Uncle Laci studied law and worked as a judge. In the communist <a href="https://www.wikiwand.com/en/articles/M%C3%A1ty%C3%A1s_R%C3%A1kosi">Rákosi</a> regime, he constantly feared forced deportation due to his position and middle-class life - not without reason, because this had already happened to several of his friends, as part of the anti-intellectual purge of the communist party. This constant fear and stress drove the poor man all the way to a heart attack which caused his death. His wife committed suicide one day later: she simply put her head in the oven and turned on the gas tap. My grandfather, still a university student living with them, found them, and it was a near miracle he didn’t ring the doorbell and the apartment didn’t explode. Our family graves are in Farkasréti Cemetery today because that’s where Viko found a place for them in the neighbourhood.</p>

<p>After his uncle and wife’s death, my grandfather “claimed” part of the apartment from the Council. They granted him the use of the flat due to his demonstrator work at the university. The tiny apartment was later divided by the Council into a three-way shared rental.  During the post-war communist times, it was common to house two, three or even more families within the same apartments. Although unthinkable by today’s standards, millions of people lived like this across the Soviet Union, sharing the toilets and bathrooms on a tight schedule with other families. This meant, an entire family had to cram into a single room - or sometimes not even that, just a hallway. My father and his two younger brothers were also born in this apartment and lived here for a while, sharing it with two other families. Moreover, during the <a href="https://www.wikiwand.com/en/articles/Hungarian_Revolution_of_1956">Revolution of ‘56</a> the Russians shot at the house - because there was a rebel machine gun nest on its roof. Later, when the Russians entered the house they threw a grenade into the shelter where my grandfather, grandmother, and my then-infant father were hiding. They owed their lives to the fact that the shelter was protected by a double door, but the Soviet soldier only opened the first one.</p>

<p><strong>Gallery</strong></p>

<figure class="third ">
  
    
      <a href="/assets/images/family_pics/rudolf.jpg" title="3rd great-grandfather, Rudolf">
          <img src="/assets/images/family_pics/rudolf.jpg" alt="3rd great-grandfather, Rudolf" />
      </a>


      <a href="/assets/images/family_pics/gyula.jpg" title="2nd great-grandfather, Gyula">
          <img src="/assets/images/family_pics/gyula.jpg" alt="2nd great-grandfather, Gyula" />
      </a>


      <a href="/assets/images/family_pics/gyulaek_nagybanyan.jpg" title="Gyula and his family in Nagybányán">
          <img src="/assets/images/family_pics/gyulaek_nagybanyan.jpg" alt="Gyula and his family in Nagybányán" />
      </a>


      <a href="/assets/images/family_pics/viktor_lajos.jpg" title="Great-grandad, Viktor Lajos">
          <img src="/assets/images/family_pics/viktor_lajos.jpg" alt="Great-grandad, Viktor Lajos" />
      </a>


      <a href="/assets/images/family_pics/roza.jpg" title="Great-grandmother, Róza">
          <img src="/assets/images/family_pics/roza.jpg" alt="Great-grandmother, Róza" />
      </a>


      <a href="/assets/images/family_pics/roza2.jpg" title="Róza and her sister in front of their butcher shop.">
          <img src="/assets/images/family_pics/roza2.jpg" alt="Róza and her sister in front of their butcher shop." />
      </a>


      <a href="/assets/images/family_pics/maria.jpg" title="Mária - several of her children ended up in Belgium">
          <img src="/assets/images/family_pics/maria.jpg" alt="Mária - several of her children ended up in Belgium" />
      </a>


      <a href="/assets/images/family_pics/maria_lanya.jpg" title="The rescue pass of one of Maria's daughter">
          <img src="/assets/images/family_pics/maria_lanya.jpg" alt="The rescue pass of one of Maria's daughter" />
      </a>


      <a href="/assets/images/family_pics/torokbalint_csalad.jpg" title="2nd great-grandfather, János with his second wife and 11 childrend in Törökbálint">
          <img src="/assets/images/family_pics/torokbalint_csalad.jpg" alt="2nd great-grandfather, János with his second wife and 11 childrend in Törökbálint" />
      </a>


      <a href="/assets/images/family_pics/laci_bacsi.jpg" title="The brother of my great-grandad, Uncle Laci">
          <img src="/assets/images/family_pics/laci_bacsi.jpg" alt="The brother of my great-grandad, Uncle Laci" />
      </a>


      <a href="/assets/images/family_pics/viktor_es_csaladja.jpg" title="Grandad Viktor with my grandma and their three sons.">
          <img src="/assets/images/family_pics/viktor_es_csaladja.jpg" alt="Grandad Viktor with my grandma and their three sons." />
      </a>


</figure>

<p><strong>Summary:</strong> my paternal grandfather’s line is a family of Slovak-descent who later Hungarianized. They were protestants who were mainly engineers, lawyers and middle-class intellectuals. Traveling the route of Nagyrőce, Nagybánya, Törökbálint, Debrecen, Pécs, Budapest, they ended up in the Hungarian capital. Uncle Laci’s and his wife’s tragic death is clearly attributable to the communist regime.</p>

<h1 id="paternal-grandmothers-line">Paternal Grandmother’s Line</h1>

<p>My 5th great-grandfather, Vencel, was born in Prague in 1735, but died in Pécs, Hungary. We don’t know how or why he moved over, but given their Germanic surname, the family was presumably German-speaking at the time.</p>

<p><img src="/assets/images/family_pics/granasztoi_jozsef.jpg" alt="image-left" class="align-left avatar" />Vencel had five sons, of whom my ancestor, my 4th great-grandfather, József, was the accountant of the Pécs cathedral chapter in the first half of the 19th century. Later, he received a patent of nobility from King Francis I on April 11, 1828, and with that he became a landowner and minor nobleman in Somogybabod. A recreated version of the coat of arms from its contemporary description still exists and is hanging on the wall of my father’s study. The patent of nobility was confiscated by the Communist State Security in July 1950.</p>

<p><img src="/assets/images/family_pics/kalman.jpg" alt="image-left" class="align-right avatar" /> The three generations following József gradually shed their landed gentry lifestyle and became bourgeois, relying on their legal education. My great-grandfather, Kálmán, sold the 900-hectare estate to the Hungarian Academy of Sciences around 1890 and they moved to Pécs. Here they and the following generations all worked in various judicial positions in public administration and lived the characteristic life of middle-class intellectuals.</p>

<p><img src="/assets/images/family_pics/laci_bacsi2_2.jpg" alt="image-left" class="align-left avatar" /> My great-grandfather - who also runs as Uncle Laci in the family history - was born in Pécs, but in addition to his legal education, he also earned a mining engineering diploma from Sopron. Sopron is a city that is now on the border of Austria and Hungary and after World War I, its fate was decided in a now legendary referendum that asked its citizens whether they wanted their city to be part of Austria or Hungary.  During this referendum, my great-grandfather and his university companions voted multiple times daily, based on names found in the cemetery, so that Sopron would remain a Hungarian city. As we know, they succeeded.</p>

<p>After graduating, he worked as a mining engineer where by sheer luck the miners unearthed the remains of a woolly mammoth. My great-grandad led the excavations and also documented the finds with great academic curiosity and rigour, inventing - at the time - new ways of preserving the delicate skeleton. Parts of this find are <a href="https://www.jpm.hu/blog/2020-05-07-a-pecsi-mamut-jobb-oldali-agyara-egy-muzeumi-preparatum-tortenete">still exhibited today</a>.</p>

<p>Later, he served in World War II, then returned to Pécs and worked as deputy mining captain. In 1950 they pinned a mining accident on him and as a victim of a typical communist show trial, he was innocently sentenced to 10 years in prison. Fortunately, he was released after three years. He didn’t talk to anyone about the physical and psychological trauma and humiliation experienced in prison for 23 years. Eventually, in 1976 he let these feelings out in the form of a 32-page memoir. While my great-grandfather was in prison, the family had to be supported by his eldest daughter, my grandmother Mária. Because of this, she had to leave school and at age 16 went to work at the Pécs Electrical Installation Company, but was fired when her father’s trial became public. Following this, she got work at the Child Nutrition Company as a secretary. Later she also worked in Budapest alongside her boss, who by then was the company’s managing director.</p>

<p><strong>Gallery</strong></p>

<figure class="third ">
  
    
      <a href="/assets/images/family_pics/granasztoi_jozsef.jpg" title="4th great-grandfather, Granasztói Jozsef">
          <img src="/assets/images/family_pics/granasztoi_jozsef.jpg" alt="4th great-grandfather, Granasztói Jozsef" />
      </a>


      <a href="/assets/images/family_pics/kalman.jpg" title="3rd great-grandfather, Kálmán">
          <img src="/assets/images/family_pics/kalman.jpg" alt="3rd great-grandfather, Kálmán" />
      </a>


      <a href="/assets/images/family_pics/laci_bacsi2_2.jpg" title="Great-grandfather, Laci with his wife and two of four daughters">
          <img src="/assets/images/family_pics/laci_bacsi2_2.jpg" alt="Great-grandfather, Laci with his wife and two of four daughters" />
      </a>


      <a href="/assets/images/family_pics/laci_bacsi2.jpg" title="Memorial plaque in Pécs for the victims of the mine accident show trial.">
          <img src="/assets/images/family_pics/laci_bacsi2.jpg" alt="Memorial plaque in Pécs for the victims of the mine accident show trial." />
      </a>


      <a href="/assets/images/family_pics/laci_bacsi2_3.png" title="My great-grandad's lab for testing preservative agents to conserve the bones of the excavated mammoth.">
          <img src="/assets/images/family_pics/laci_bacsi2_3.png" alt="My great-grandad's lab for testing preservative agents to conserve the bones of the excavated mammoth." />
      </a>


</figure>

<p><strong>Summary:</strong> My paternal grandmother’s line is a family that moved from the Prague area already in the mid-1700s. They were presumably originally German-speaking then they were Hungarianized, and as lawyers, landowners and middle-class intellectuals with strong Catholic roots, contributed to Hungarian society in various roles and capacities for centuries, as they lived in the area of Pécs from 1770 to 1982. My great-grandfather’s imprisonment and persecution, as well as my grandmother’s derailed life and studies, are clearly attributable to the communist regime.</p>

<h1 id="maternal-grandmothers-line">Maternal Grandmother’s Line</h1>

<p><img src="/assets/images/family_pics/daniel.jpg" alt="image-left" class="align-left avatar" />   This branch of the family tree can be traced back to the early 19th century. My grandmother’s ancestors were Vojvodina Swabians with German names who spoke German well. My great-grandfather, Dániel, was a professional soldier, a bridge builder, who served on the Italian front in World War I. He was decorated for his service and pensioned from the military with severance pay with which he was able to buy a café and a general store in Szeged. The café was located in Kölcsey street, which is the most central shopping street of Szeged to this day. He threw everyone out of the café after 9 pm because he wasn’t a night owl. This of course didn’t make him very popular with the customers, and eventually he sold the café.</p>

<p>Despite being a decorated soldier who served for his homeland and operated a shop and café in one of the country’s major cities, after World War II he was sentenced to five years in prison and complete confiscation of all his property based on entirely made up political accusations. Like so many of his contemporaries with German heritage, names, and cultural ties, he was falsely accused by the Hungarian government of SS membership. This was outrageously duplicitous as a charge, since the Hungarian  government had <a href="https://real.mtak.hu/172454/1/regio-2023-1-03-markus.pdf">signed an official agreement with Nazi Germany</a> that allowed ethnic Germans living in Hungary to be recruited into the Waffen-SS by coercion or later by sheer force. My great-grandad was nearly 60 years old, when he was entered into the membership books of Waffen-SS, without his knowledge. Several of his brothers were also “recruited” and were sent to Russian  frontlines. One of them, Andreas or Uncle Poldi  deserted with a Jewish labour camp prisoner and made his way back to his home in Transylvania, where he hid in his own basement for an entire year.</p>

<p>My  great-grandad was 63 when he got released, after serving 2.5 years for these made up charges. Then, to make things even more devastating, based on the principle of collective guilt, the family received a deportation order as part of the <a href="https://www.wikiwand.com/en/articles/Flight_and_expulsion_of_Germans_\(1944%E2%80%931950\)">expulsion of the ethnic German families</a>.</p>

<p>This is an overlooked and very sad chapter of the post WWII era, where across Eastern Europe half a million ethnic German families were forcibly deported from their homes and sent to Germany and other territories without anything but a suitcase. These families - as my great-grandfather’s - had been living in their home countries for centuries and often arrived there as early as the 17th century, <a href="https://www.wikiwand.com/en/articles/Danube_Swabians">travelling down the Danube</a>.</p>

<p>Upon receiving the deportation order, my great-grandfather strongly considered leaving, since he was badly mistreated and already penniless, but his daughter, my grandmother Liza, appealed to the Ministry of Interior Affairs and as a result they canceled the order. The family was allowed to stay. Not like their 185,000 fellow ethnic Germans, who after often multiple generations or even centuries of Hungarian life became dispossessed and exiled, so that their houses, shops, and lands could be “taken over” by their own neighbors, the “real” Hungarians.</p>

<p>Life’s strange irony is that when we’re in Budapest visiting family, we stay in Budaörs in an apartment building built on the site of a former Swabian house. Its former owners might have been just such Swabians as my great-grandfather. Only they couldn’t stay in their place, poor souls. They were deported under brutal circumstances just as their ancestors had arrived on the Danube centuries earlier: penniless and traveling into nothingness. Interestingly, the stories, culture, and memory of the Swabians deported from (and remaining in) Budaörs and the surrounding area are preserved and maintained by the <a href="https://heimatmuseum.hu/de/home-page-de-03/">Jacob Bleyer Heimatmuseum</a>, just one street away from our apartment.</p>

<p><img src="/assets/images/family_pics/berti_liza.jpg" alt="image-left" class="align-right avatar" /> <strong>Summary:</strong> My maternal grandmother’s line is a German-origin Swabian family who had lived in the southern part of Hungary for several hundred years. Despite fighting for the country in World War I, receiving a medal for his service and living as a respected citizen, my great-grandfather was persecuted, all his belongings were confiscated, and his family was sentenced to forced deportation. Thankfully, this didn’t happen because of my grandmother’s appeal, who was therefore able to meet my grandfather.</p>

<p><strong>Gallery</strong></p>

<figure class="third ">
  
    
      <a href="/assets/images/family_pics/daniel.jpg" title="Great-grandad, Daniel">
          <img src="/assets/images/family_pics/daniel.jpg" alt="Great-grandad, Daniel" />
      </a>


      <a href="/assets/images/family_pics/daniel2.jpg" title="Family of my great-grandad with some of his brothers in the background wearing military uniforms.">
          <img src="/assets/images/family_pics/daniel2.jpg" alt="Family of my great-grandad with some of his brothers in the background wearing military uniforms." />
      </a>


      <a href="/assets/images/family_pics/berti_liza.jpg" title="My grandparents, Berti and Liza">
          <img src="/assets/images/family_pics/berti_liza.jpg" alt="My grandparents, Berti and Liza" />
      </a>


</figure>

<h1 id="maternal-grandfathers-line">Maternal Grandfather’s Line</h1>

<p><img src="/assets/images/family_pics/albert.jpg" alt="image-left" class="align-left avatar" />  My 3rd, 2nd and 1st great-grandfathers were all Jewish merchants, some of them wine merchants. Within a few generations the family ended up in Budapest via Gyón (Dabas) and Szolnok. My grandfather, Albert (to me Berti) was already born in the capital. He was 14 years old in 1944, during the horrors of the Holocaust. My grandmother wrote down his memories decades after the war, from which we know the following details:</p>

<p>Following the German occupation, my grandad’s family had to wear yellow David stars and leave their József Street apartment in the 8th district. That flat was then promptly taken over by a couple - both devout members of the <a href="https://www.wikiwand.com/en/articles/Arrow_Cross_Party">Arrow Cross Party</a>. This party was essentially the Hungarian Fascist Party and its paramilitary wing - along with its members - played an outsized and bonechillingly bloody role in rounding up the Jews around Hungary. They assisted the Germans with such vehemence and brutality that the Germans themselves were utterly puzzled by this. There are surviving documents that capture the amazement of the SS and German military leaders by the willingness, efficiency and sheer enthusiasm of the Arrow Cross Party members in assisting them in the “Final Solution”.</p>

<p>After they were forcibly removed from their flat, my grandfather’s family moved to the “starred house” - i.e. a house part of the Jewish Ghetto at the corner of Kertész and Dob streets. There they were only allowed to take their personal clothing. This apartment belonged to Dr. Lipót Klug, a university professor, who originally came from Kolozsvár, which is part of Romania today. The apartment was protected by exemption rights thanks to its owner. Klug Lipót’s housekeeper was Berti’s great-aunt, who was also entitled to exemption rights through Dr. Klug. After moving to the starred house, it was no longer possible to work or pursue any studies. Following the takeover of the Arrow Cross Party on October 16, 1944, their members and SS soldiers herded all four of them (my grandfather, his two sisters, and his mother) down to the building’s basement and confiscated all their belongings - with body searches. On the same day, my great-grandfather, Dezső, managed to escape from a labor camp in the southern region of Hungary and found his family in the basement.</p>

<p><img src="/assets/images/family_pics/schwarzek.jpg" alt="image-left" class="align-center" /></p>

<p>That same evening around 10 o’clock, the special units of the Arrow Cross Party and SS soldiers drove them out of the house again. They lined them up in rows of five on Dob Street and with another body search took away the remaining items still with them, saying: “You won’t need these anymore.” Word spread that they were taking them to the Danube bank for execution. A German Tiger tank stood behind the rows of terrified people. Together with similarly rounded-up people from surrounding streets, there were several thousand of them. Meanwhile someone appeared - later presumed to be Raoul Wallenberg. He was a Swedish diplomat who managed to save thousands of Jewish families by issuing protective passports to them. Later, he was captured by the Soviets and presumably killed. He was only 35 at the time.  Wallenberg began negotiating with the special units taking my grandfather’s family and thousands of Jews for execution, and as a consequence they were herded not to the Danube bank but to the Kazinczy Street synagogue. Here they languished for four days without any kind of food. After four days, Hungarian police opened the synagogue and asked everyone to very quietly return to their previous starred house.</p>

<p>The story continues from here with further incredible turns. Despite the fact that my grandfather’s sisters and father were already taken to do forced labor in the Óbuda brick factory, my grandad was able to obtain protective passports for all of them, by patiently standing in line in front of the “Glass House” on Vadász Street. This building was where the Swiss Legation’s Foreign Interests &amp; Immigration Department operated at the time. The operation in the “Glass House” was nothing other than an incredibly large-scale Jewish rescue operation organized by Carl Lutz, the contemporary Swiss consul. Within this programme more than 50,000 illegally issued protective passes were given out, which entitled the holder to emigration to Palestine. Furthermore, as part of the programme, the pass holders could shelter in relative safety in one of Switzerland’s 76 protected houses. After obtaining the passes, and escaping from the brick factory, my grandad’s family moved to one of these, at 16 Pozsonyi Road. The Swiss protective pass program - comparable to Wallenberg’s efforts - verifiably saved several thousand families, even though the Arrow Cross Party regularly raided these safe houses and dragged people away for execution.</p>

<p>This happened to my grandfather’s sisters and mother too, whom the fascists took to the Danube bank to execute. My grandad was deemed too young and my great-grandfather too old to be taken on this occasion. With incredible luck, a Soviet Rata fighter plane was flying low over Szent István Park, which frightened the Arrow Cross guards escorting the abducted and they scattered. Taking advantage of this situation, the group also broke up and the girls and my great-grandmother fled back to the protected house. It was already mid-January, one of the most intense phases of the siege of Budapest, when the Arrow Cross raided again and moved them to the Dob Street ghetto. On January 18th they noticed that Soviet soldiers had appeared on the street. For the first time in years, they could breathe freely then. Miraculously, the entire family had survived.</p>

<p>My great-grandfather’s sister, Margit and her family weren’t so lucky. They were deported and died in Auschwitz. So did nearly 600,000 Jewish Hungarian citizens, whom the Hungarian state apparatus sent to death with unprecedented efficiency and cruelty. Less than half of the capital’s Jewish population survived the Holocaust, but this was still much better than what happened to rural Jewry. After the World War I’s Trianon treaty, 704 Jewish communities existed in 1939, but only 263 in 1946 after World War II. In the following years their numbers gradually decreased due to emigration, state pressure, and the breakdown of traditional lifestyle. In Transcarpathia, about 400 communities operated before the war, twenty in 1946, only four by 1950.</p>

<p><strong>Gallery</strong></p>

<figure class="third ">
  
    
      <a href="/assets/images/family_pics/albert.jpg" title="2nd great-grandad, Albert">
          <img src="/assets/images/family_pics/albert.jpg" alt="2nd great-grandad, Albert" />
      </a>


      <a href="/assets/images/family_pics/schwarzek.jpg" title="Schwarz family, with my grandad in the middle">
          <img src="/assets/images/family_pics/schwarzek.jpg" alt="Schwarz family, with my grandad in the middle" />
      </a>


      <a href="/assets/images/family_pics/uveghaz.jpg" title="Jews queuing for safe-passes in front of the Glass House">
          <img src="/assets/images/family_pics/uveghaz.jpg" alt="Jews queuing for safe-passes in front of the Glass House" />
      </a>


      <a href="/assets/images/family_pics/carl_lutz.jpg" title="Carl Lutz, contemporary Swiss consul, whose programme saved thousands of Jewish families, including my grandad's.">
          <img src="/assets/images/family_pics/carl_lutz.jpg" alt="Carl Lutz, contemporary Swiss consul, whose programme saved thousands of Jewish families, including my grandad's." />
      </a>


      <a href="/assets/images/family_pics/raoul_wallenberg.jpg" title="Raoul Wallenberg, Swedish architect, businessman and diplomat, whose efforts saved thousands of Jewish families.">
          <img src="/assets/images/family_pics/raoul_wallenberg.jpg" alt="Raoul Wallenberg, Swedish architect, businessman and diplomat, whose efforts saved thousands of Jewish families." />
      </a>


</figure>

<p><strong>Summary:</strong> My maternal grandfather’s line is a Jewish merchant family, which was only partially successfully exterminated, thanks to the Swiss embassy’s rescue operation and the Swedish Wallenberg. Understandably, after the Holocaust, my great-grandad changed the family’s name from Schwartz to a more  Hungarian sounding one.</p>

<h1 id="who-can-live-here">Who Can Live Here?</h1>

<p>On the paternal side, we therefore see families settled from Slovakia and Czech Republic who had lived, even prospered in Hungary for generations, living respectable bourgeois lives. They were independently subjected to serious trauma during the communist era.</p>

<p>In contrast, on the maternal side we find long-settled Swabians, with a decorated war veteran who was later still condemned to prison and deportation, and a half-exterminated Jewish merchant family.</p>

<p>The question therefore arises in one’s mind: who exactly can live undisturbed in this country? From the above it seems that one can live here for hundreds of years and can be:<br />
- Catholic, Protestant, or Jewish,<br />
- an engineer, a lawyer, a soldier, or a merchant,<br />
but Hungary will still hold little “surprises” for them nonetheless.</p>

<p>I’ve been thinking for weeks about the commonality in these fates. I felt that something connects these stories, but I couldn’t precisely articulate what. Until one morning lying in bed it occurred to me: I can’t find a word for it because there isn’t one. So I created one: “reverse-treason,” that is, treason with full role reversal.</p>

<p class="text-center"><strong>My ancestors didn’t betray their homeland,<br /> instead their homeland betrayed them.</strong></p>

<p>Without exception. All of them. After multiple generations of active and enthusiastic contribution to Hungary, regardless of where they lived, what they believed in, and what they did for a living, this country once decided to sideline them or even exterminate them completely.</p>

<p>When I finally saw this clearly and dared to say it out loud, then almost twenty years of repressed tension and soul-searching ended within me. In a cathartic way, but still without any anger or emotion, and with a big sigh, I finally arrived at the closure of my relationship with Hungary. It was gone and done. Forever.</p>

<h1 id="epilogue">Epilogue</h1>

<p>The reader might justifiably wonder whether the same fate would have awaited my ancestors in Poland, Czechoslovakia, or Romania too. If so, Hungary is not unique and my ancestors’ embarrassingly unanimous stories can be explained purely by the blood-soaked 20th century and Hungary’s geographical location. Although I can’t rule it out, I doubt it would be so, and what’s more important, it wouldn’t change the story’s final conclusion for me in either direction.</p>

<p>However, there is something that could have changed my conclusion - beyond avoiding the reprehensible politics of Orban in the last 15 years. And that would have been if I didn’t feel that this state, this country is still very much capable of betraying its citizens yet again, as it did with my ancestors. But not only do I not feel this, I fear we’re closer to reverse-treason today than we were 30 years ago. I don’t know why this is so, but I suspect the following ingrained patterns strongly contribute.</p>

<p>With few deeply deserving exceptions, most nations love to deflect historical responsibility and avoid confronting their questionable past deeds. When they do reckon with it, they often do so belatedly, offering inadequate apologies while relativizing their actions. This is true for countries ranging from Great Britain to France to Belgium. But Hungarian historical memory unfortunately goes even beyond this—not only failing to face numerous shameful historical facts, but actually casting the country’s role in a victim narrative, which creates completely perverse situations.</p>

<p>This happens when Hungary minimizes, relativizes, and even declares essentially irrelevant <a href="https://www.wikiwand.com/en/articles/History_of_the_Jews_in_Hungary#Interwar_period_\(1918%E2%80%931939\)">its role in the systematic, decades-long marginalization of Hungarian Jewry</a> and the destruction of 70% of them, deflecting blame onto the Nazi occupation. This extremely cynical and self-reflection-incapable historical memory emerges in folk legends like the claim that Horthy was a savior  of Jews - <a href="https://atlatszo.hu/kult/2020/06/11/horthy-miklos-egyertelmuen-felelos-volt-a-feherterrorert-es-a-zsidok-deportalasert-is/">which is a lie</a> - or the unqualifiable <a href="https://www.wikiwand.com/hu/articles/A_n%C3%A9met_megsz%C3%A1ll%C3%A1s_%C3%A1ldozatainak_eml%C3%A9km%C5%B1ve">heap of kitsch meant to commemorate the victims of German occupation</a>, which grotesquely depicts Hungary as an angel being kidnapped by an evil German eagle. Against these romanticized lies, reality shows a much more <a href="https://www.youtube.com/watch?v=_BUKzVgtuos">bone-chilling</a> and <a href="https://www.youtube.com/watch?v=4ygZB1MTRR4">sobering</a> picture of the Hungarian government’s and Hungarian population’s actual role.</p>

<p>Hungarian historical memory does the same thing when processing the violent deportation of ethnic Germans. Then it’s customary to play the well-worn victim narrative trump card of the Potsdam Conference, claiming that the violent deportation of 185,000 ethnic German minority happened purely at the request of the victorious powers. This, however, <a href="https://www.youtube.com/watch?v=CgkCad25Pjw&amp;t=3352s">is simply not true</a>.</p>

<p>And what can we say about confronting the communist past in a country that still hasn’t succeeded in making communist era files public to this day, thus completely preventing the nation from coming to terms with the trauma and wounds inflicted by communist era?  What can we say about a country, where the ruling party of 16 years - though fiercely nationalist and anti-communist while simultaneously pro-Russian - still contains several Communist Party members, and agents of the dreaded Communist <a href="https://www.wikiwand.com/en/articles/State_Protection_Authority">State Protection Authority</a> in high government positions. And finally, what should we do with today’s Hungarian government, presenting itself as a victim, whining about its “grievances” and advancing Russian propaganda, while its neighbour, Ukraine - where Hungarians also live in significant numbers - has been bombed, butchered and terrorized by Putin’s regime for three years?</p>

<p>These and numerous other historical examples show that Hungary’s capacity for historical self-reflection has been in deficit for several hundred years. Instead, a victim narrative - incompatible with historical facts - is often the dominant reflex that determines Hungary’s historical self-image.</p>

<p>It’s a cliché repeated countless times that if historical crimes aren’t confronted by a critical mass within a country or ethnic group, then that society cannot learn anything from what happened. This obviously creates fertile ground for future tragedies.</p>

<p>I can only hope that after another generation passes, these reflexes will improve in Hungary, but I wouldn’t bet my life on it. The problem is that while being 1000 years old looks good on a tourism brochure, it’s also a double-edged sword. Namely, 1000-year-old things rarely change, and especially rarely renew themselves.<em>**</em></p>]]></content><author><name>danielhomola</name></author><category term="M &amp; E" /><category term="history" /><category term="hungary" /><category term="history" /><category term="family" /><summary type="html"><![CDATA[The stories and fates of four families, woven through the centuries of Hungary, all ending painfully similarly.]]></summary></entry><entry><title type="html">Letters to M &amp;amp; E</title><link href="https://danielhomola.com/m%20&%20e/letters-to-m-and-e/" rel="alternate" type="text/html" title="Letters to M &amp;amp; E" /><published>2025-09-01T00:00:00+02:00</published><updated>2025-09-01T00:00:00+02:00</updated><id>https://danielhomola.com/m%20&amp;%20e/letters-to-m-and-e</id><content type="html" xml:base="https://danielhomola.com/m%20&amp;%20e/letters-to-m-and-e/"><![CDATA[<p>My mother gave me two lives.</p>

<p>The first in a Helsinki hospital, sometime in the late eighties. The second she gave me as she tragically passed away while battling with cancer - in just 72 brutal days.</p>

<p>I don’t mean that metaphorically, or at least not entirely. Grief of a parent does something strange to a person. When the full weight of how short and precious life actually is finally crashes down on you - not as an idea you’ve nodded along to, but as something you feel in your bones and aching heart at 3am - it forges you into someone new. I came out the other side a different man. At 37, my mother gave me a second birth. I’ve been trying to figure out what to do with it ever since.</p>

<p>One thing became clear as day: procrastinating on projects and goals is not an option anymore. Endless pondering and fucking around is the enemy. Doing is the remedy.</p>

<p><a href="/assets/images/mamaval.jpg"><img src="/assets/images/mamaval.jpg" width="100%" /></a></p>

<p>After the birth of our daughter, I was ambushed by feelings I had never felt before. Some days I felt crushing anxiety and the onset of a new kind of impostor syndrome - the kind only parents know. The classic</p>

<blockquote>
  <p>“WTF am I doing?” and “How is this kid still alive?”</p>
</blockquote>

<p>kind. In other moments I felt a joy so visceral and primal it knocked me off my feet and made every other high-point in my life pale in comparison.</p>

<p>And then one day, something else arrived: inspiration. I realised that watching a young human grow up, and guiding her through that journey, is not just the greatest responsibility I’ll ever take on, but the greatest privilege. There’s so much I want to share with her. Little pieces of knowledge that made my mind explode when I first encountered them. Pet theories I’ve cultivated over the years to make sense of the world. Ideas about science, music, love, and so much more.</p>

<p>It felt selfish - and it is - but it’s also what makes us human. The incremental growth of knowledge across generations, passed from one to the next, is what took us from caves to the Moon, and from dying of a simple cut wound to defeating Covid.</p>

<p>Of course there is school and university for most of this. But there’s so much outside those curricula, and rightly so: questions about morality and values, explanations of the world that span several disciplines and are therefore often missed by our fragmented education system, the kind of hard-won things you only understand after you’ve lived a bit.</p>

<p>So I had the idea to start a series of blog posts - letters, really - where I share things I hope will be valuable to my children.</p>

<blockquote>
  <p>“Why not just wait till she grows up and talk to her?”</p>
</blockquote>

<p>I hear you ask. Well, who knows how long I’ll be around, and what life will bring. My beloved mother was just 66 - full of life and with many plans, when it was decided that her story will be cut a lot shorter.  It’s better to write things down now, so they can be revisited when the time is right. And maybe some of these letters will be useful for others too. It certainly provides a great excuse to spout unsolicited advice, opinions and theories into the ether.</p>

<p>I first had this idea in 2021. Then life happened - moving countries, building a home, a second child on the way, a little boy this time. I kept finding reasons to wait. Then my mother was taken from us in less than 3 months and by the time I processed the most intense stages of grief I ran out of reasons not to write.</p>

<p>Our daughter’s name starts with M. Our son’s with E. Hence: <em>Letters to M &amp; E</em>. It also neatly reminds me that most likely no one will ever read these - except, hopefully one day, the two people who matter most.</p>]]></content><author><name>danielhomola</name></author><category term="M &amp; E" /><summary type="html"><![CDATA[One of the pleasures of being a parent, is that you can bore your children with unsolicited advice.]]></summary></entry><entry><title type="html">My startup failed, now what?</title><link href="https://danielhomola.com/startups/learning/my-startup-failed/" rel="alternate" type="text/html" title="My startup failed, now what?" /><published>2020-10-10T00:00:00+02:00</published><updated>2020-10-10T00:00:00+02:00</updated><id>https://danielhomola.com/startups/learning/my-startup-failed</id><content type="html" xml:base="https://danielhomola.com/startups/learning/my-startup-failed/"><![CDATA[<h2 id="the-1-minute-version">The 1 minute version</h2>

<p>I was part of the EF12 London cohort in 2019, where I met my co-founder. Together, we pursued an idea that I had for a while:</p>

<blockquote>
  <p>A privacy-preserving medical-data marketplace and AI platform built around federated deep learning.</p>
</blockquote>

<p>The purpose of the platform would have been to allow data scientists to train deep learning models on highly sensitive healthcare data without that data ever leaving the hospitals. At the same time, thanks to a novel data monetization strategy and marketplace component, hospitals would have been empowered to make money from the data they are generating.</p>

<p>We received pre-seed funding, valued at $1M. Then the race for demo day began with frantic product building and non-stop business development. Unfortunately, my co-founder fell out of love with the idea after enduring months of business development hardship. Then we failed to pivot to something we both liked, so we split up and I went on my own way.</p>

<p>The whole ordeal was an amazing mixture of fun, challenging learning opportunities and uninhibited misery (but mostly fun). Make sure to check out the <a href="/federeated_learning_platform">demo of the MVP</a> I built.</p>

<p>If you are curious about the details of the story then read on. If you’re in a rush, feel free to skip ahead to the <a href="#takeaways">list of things I learned</a> from the experience.</p>

<h2 id="how-to-find-a-co-founder">How to find a co-founder?</h2>

<p>Back in early 2019, I left my job at IQVIA to join the London cohort of <a href="https://joinef.com">Entrepreneur First</a>. EF is an amazing incubator / accelerator programme that has given the world the likes of <a href="https://techcrunch.com/2016/06/20/twitter-is-buying-magic-pony-technology-which-uses-neural-networks-to-improve-images/">Magic Pony</a> and <a href="https://www.joinef.com/companies/">hundreds of other exciting companies</a>.</p>

<h3 id="entrepreneur-what">Entrepreneur what?</h3>

<p>The main thing that sets EF apart from the dozens of similar programmes is that they focus on the earliest possible stage of companies: sole founders. They take in a hundred talented and ambitious individuals in each cohort (actually almost 200 when you count the other European EF sites: Berlin and Paris).</p>

<p>Then the good people of EF will</p>

<blockquote>
  <p>make everyone go through a weird, speed-dating meets Love Island type of co-founder finding process.</p>
</blockquote>

<p>In this phase, for weeks on end, you are simultaneously reading the CVs of super interesting cohort members and having ludicrously blue-sky chats with them, about potentially world changing companies the two of you could build. By the end of this process, you should end up with a co-founder.</p>

<p>EF also gives you a stipend, a place to work and a ton of high quality material on the basics of entrepreneurship and startup building. But I think the real USP of EF, is the access to this pool of pre-screened, highly talented and motivated people,  who all left their (sometimes lucrative) day jobs to become members of the cohort and build companies.</p>

<h3 id="from-beers-to-business">From beers to business</h3>

<p>As a naturally sceptical person, I wasn’t sure what to think about this process. I did what was expected of me (reading CVs, talking to people, coming up with outlandish ideas) but I didn’t really click with anyone.</p>

<p>Finally however, after many beers and chats, I found my co-founder, with whom we just had enough in common (interest in healthcare and machine learning) to make our discussions fruitful, but with whom our skills were complimentary enough that we could take advantage of having two people on the team.</p>

<p>This latter point is in fact quite crucial: too often, we are naturally attracted to people with similar interests, skills and thinking to our own. This is great for friendships, but can be devastating in a startup where</p>
<blockquote>
  <p>you want the co-founders to cover each other’s blind spots.</p>
</blockquote>

<p>Both my co-founder and I are “techies” in broad terms. But it was quite clear from the beginning that I am more of a CTO type who loves to build, whereas he liked the process of selling and pitching, which is quite important because that’s pretty much <strong>all you do</strong> as an early stage startup CEO.</p>

<p>Fortunately (as this is quite rare AFAIK), we both had a good share of the skills of the other’s role too. This really helped with both the technical and business discussions between the two of us.</p>

<h2 id="do-you-have-a-1b-idea">Do you have a $1B idea?</h2>

<p>Something we all learned fairly quickly in EF was the economics of venture capital. It’s really quite simple and goes something like this:</p>

<h3 id="venture-capitalism-101">Venture capitalism 101</h3>

<ul>
  <li>There’s a huge amount of excess money slushing around in the global financial system.</li>
  <li>Most investors stratify their investment portfolios according to some risk profile. This usually means that they are happy to put 1-2% of their capital in high-risk ventures. Funding highly risky tech startups is one of these high-risk venture types. Another would be to buy crypto for instance.</li>
  <li>VC firms utilise this and go out every $latex x$ years to <em>raise a round</em>, i.e. pool together capital from wealthy individuals and investment funds.</li>
  <li>Whatever they raise is the fund that can be allocated by the partners of the VC firm, as they see fit.</li>
  <li>Most VCs work on a 2/20 rule: they will take 2% management fee each year, plus 20% of any profit they make.
    <ul>
      <li>It’s worth noting here, that 2% of a billion-dollar fund is still a few million for each partner each year, even if none of their funded companies exit or do particularly well. Yeah, being a VC is quite lucrative.</li>
    </ul>
  </li>
  <li>VCs promise extraordinary returns to the investors. Certainly well above anything that’s attainable with reasonable risk profile on the market. How can they deliver?
    <ol>
      <li>To achieve this they can either fund companies where they expect that most of them will grow 100%.</li>
      <li>Or fund companies where none of them will grow a 100%, because most will grow 0%, and potentially one or two will grow 1,000% or 10,000%.</li>
    </ol>
  </li>
</ul>

<p>Companies from the first group are called successful medium sized business. The latter ones are called unicorns: startups in hyper-growth mode, overtaking and disrupting a whole industry like AirBnB or Uber did for example.</p>

<h3 id="not-all-ideas-are-created-equal">Not all ideas are created equal</h3>

<p>Even though probably both investment models could be equally successful, <strong>VCs want to invest in high impact firms</strong> that will change the world. Think Google, Facebook, Twitter.</p>

<p>I leave it to your judgement whether this is a healthy and sustainable business model. I will certainly write more about this in the future, but I will say this: VCs serve a super important function in the global innovation market and without them, the world would be different in countless ways.</p>

<p>The corollary of all the above is that if you go down the VC backed startup building path, you need an idea that can become a 1 billion-dollar company. <strong>Yes, that’s a billion with a B.</strong></p>

<h2 id="start-me-up">Start me up!</h2>

<p>We spent weeks ideating with my co-founder, but after dozens of discussions we came back to the idea I arrived to EF with. It was the only one that seemed simultaneously ambitious and high impact enough that a VC might take a liking to it, while also having the potential to grow into a multi billion-dollar company. Also, neither of us hated it, which is quite important, I heard.</p>

<h3 id="the-idea">The idea</h3>

<p>I had this idea for a company for months before applying to EF:</p>

<blockquote>
  <p>The world’s first, privacy-centered medical-data marketplace and machine learning platform, powered by federated deep learning.</p>
</blockquote>

<p>I couldn’t wait to tell all the people at the cohort about it, so I did. And they all made the exact same face you just did when you read the sentence above.</p>

<p>The problem with deep tech ideas (besides not fitting on a napkin) is that for the most of us not well-versed in the particular field, they are often indistinguishable from vaporware and snake-oil.</p>

<p>You really have to know a lot about healthcare informatics, medical machine learning, federated deep learning and also the financial incentive structure of the US healthcare industry to properly evaluate that one sentence above.</p>

<p>If you do that, it will not only make a lot of sense but you’ll find that it’s offering one of the very few viable long-term solutions to the impossible trade-off healthcare faces in the 21st century:</p>

<blockquote>
  <p>The patients’ natural right to data privacy is in direct conflict with data pooling and with how much we can learn from this data with current AI algorithms.</p>
</blockquote>

<p>This is bad news, because without the deployment and proliferation of AI, <a href="https://www.goodreads.com/book/show/40915762-deep-medicine">healthcare is doomed</a>. Another indication that the above idea might not be the worst ever is that Google Ventures already backed an <a href="https://owkin.com/federated-learning/">amazing team</a> to do exactly this. Yeah, finding that out wasn’t fun…</p>

<h3 id="the-idea-explained">The idea explained</h3>

<p>Probably it’s easiest to explain the idea for our startup by enumerating some of the relevant problems that plague healthcare currently:</p>

<ul>
  <li>Hospitals and outpatient clinics generate vast amounts of incredibly rich and detailed data about patients.  We’ll call these institutions providers.</li>
  <li>This generated patient data is extremely sensitive, and people are rightly concerned about who gets to use or analyse it.</li>
  <li>Pharmaceutical companies, biotech and medtech AI startups are all hungry for this data and could develop amazing new drugs, therapies, diagnostic tools, algorithms by leveraging it. We’ll call these companies vendors.</li>
  <li>Providers are often cash-stripped and as a consequence struggling to provide the highest quality of care for their patients.</li>
  <li>Vendors have ample resources (money) and a clear need to access this data. Furthermore, by providing this data to them securely, the world could undoubtedly become a better and healthier place through their innovation.</li>
  <li>Even if vendors had access to this data, deploying AI models at scale, in a live hospital setting is still one of the biggest unsolved challenges of digital healthcare.</li>
</ul>

<p>Once you write down these six simple facts about today’s healthcare systems, it really doesn’t take long for the light bulb to start flashing.</p>

<p>We need to build a marketplace where providers can sell access to their data without compromising patient privacy and where vendors can get access to this data to learn from it and train models on it. Furthermore, once vendors have a model trained, they need to be able to easily deploy it to network of hospitals, where those models could start to generate useful (and potentially life-saving) predictions.</p>

<blockquote>
  <p>But how could anyone use sensitive data without actually having a look at it, thereby immediately compromising patient privacy?</p>
</blockquote>

<p>The answer is quite remarkably simple, and it’s been powering all sorts of technologies (like predictive texting on your phone) for years. It’s called <strong>federated learning</strong> and it’s first real-world, large scale application came from Google (as far as I know) following <a href="https://arxiv.org/abs/1511.03575">this paper</a>. Then, <a href="https://arxiv.org/abs/1610.05492">many</a> - <a href="https://arxiv.org/abs/1806.00582">more</a> - <a href="https://arxiv.org/abs/1902.01046">followed</a> and amazing open source libraries were released like <a href="https://github.com/OpenMined/PySyft">PySyft</a> by <a href="https://www.openmined.org/">OpenMined</a>, or <a href="https://github.com/FederatedAI/FATE">FATE</a> by <a href="https://www.wikiwand.com/en/WeBank_(China)">WeBank</a>.</p>

<p>Federated learning’s simplest explanation can be boiled down to a single sentence:</p>

<blockquote>
  <p>Instead of moving the data to the model, <strong>let’s move the model to data.</strong></p>
</blockquote>

<p>Suffice to say that this idea has found applications in several security and privacy conscious industries, but its impact on healthcare will truly be transformational. Have a look at these two recently published Nature articles to see what federated learning holds for the future of <a href="https://www.nature.com/articles/s41598-020-69250-1">multi-institutional medical studies</a>  and <a href="https://www.nature.com/articles/s41746-020-00323-1">digital health applications</a>.</p>

<p>If you’re curious about the technical details and implementation of our idea, <strong>make sure to check out</strong> <a href="/federeated_learning_platform"><strong>this page</strong></a> about the MVP I built, or watch my demo of it below.</p>

<!-- Courtesy of embedresponsively.com //-->

<div class="responsive-video-container">
    <iframe src="https://www.youtube-nocookie.com/embed/KZBNBdD1yVI" frameborder="0" webkitallowfullscreen="" mozallowfullscreen="" allowfullscreen=""></iframe>
  </div>

<h3 id="to-recap">To recap</h3>

<ul>
  <li>We wanted to build a platform to enable researchers and data scientists of pharma and biotech companies to access highly granular and information rich patient data from US hospitals to train models on it,</li>
  <li>without the data ever leaving the four walls of those hospitals and without the researchers ever being able to actually look at the data.</li>
  <li>We wanted to leverage federated deep learning and a federated data query engine to achieve this.</li>
  <li>The best part? The hospitals would have made money out of the mountains of data they are sitting on, without ever compromising patient privacy, while simultaneously enabling vendors to innovate, research and develop therapies.</li>
  <li>Furthermore the learned algorithms could have been deployed back to the federated hospital network and put to good use.</li>
  <li>We wanted to charge vendors according to the well-known <a href="https://stripe.com/en-gb/atlas/guides/business-of-saas#the-fundamental-equation-of-saas">SaaS business model</a> and share a sizeable fraction of our revenue with the hospitals so they become financially incentivised to partner with us.</li>
  <li>How? Every time a hospital’s data would have been used to train a model, they would have got compensated based on the number of patients and data granularity they provided for the study.</li>
</ul>

<p>Here’s a flowchart of the smallest possible incarnation of our platform with just two hospitals connected to the federated data network.</p>

<p><a href="/assets/images/fedml_overview.png"><img src="/assets/images/fedml_overview.png" /></a></p>

<h2 id="the-rollercoaster-of-founder-life">The rollercoaster of founder life</h2>

<p>The EF programme is structured according to a fairly well thought out schedule that gives a nice framework for working on your idea.</p>

<ul>
  <li>In the first few weeks you should get data about the market’s reaction to your idea. This means you’re constantly on the phone (sometimes for 6-8 hours straight), talking to people, who are often not that interested, but you begged your way in or forced them some other way.</li>
  <li>You’re doing all of this to basically <a href="http://momtestbook.com/">“Mom test” your idea</a>.
    <ul>
      <li>This is a neat little trick to get around the problem of people being too nice. Yes, that’s actually a problem, as they’ll outright lie in your face and say that they like your idea and would even pay for it. Only then to completely disappear after the call.</li>
      <li>The reason for this is quite simple: no one likes to be the a-hole who breaks the soul of budding entrepreneurs. Contrary to popular belief, people on average are fairly nice that way, so they’ll naturally try to say something good about your idea, even if it’s objectively terrible and they knew from the second minute, they’ll never ever use it.</li>
    </ul>
  </li>
  <li>In this early phase, it’s not a big deal if people are hanging up on you. You should just have as many calls as possible, be resilient and accept that no one cares about your idea besides you. Keep your head down, collect data and try to find out if there’s anyone out there even remotely interested in buying what you have to offer.</li>
  <li>In the next phase of your VC fuelled company building, you are trying to produce some form of <em>“traction”</em> to prove to your future investors (the EF Investment Committee (IC) in our case), that in fact, your idea is a viable business.</li>
  <li>Traction can be many things, depending on the complexity of your product. Here are a few types of traction in decreasing order of impressiveness:
    <ul>
      <li>Signed up users / companies with their card details already taken, ready for doing business with you.</li>
      <li>Signed contract with another business for a (hopefully) paid trial. Contract for an unpaid trial is the next best thing here.</li>
      <li>Letter of intent from another company or institution. This is usually a document with purposefully vague and legally non-binding language in which your future client (you wish) says that they don’t think your idea is totally crazy and (if the stars align and the director wakes up in the right good mood) they might even consider using it one day. Maybe…</li>
    </ul>
  </li>
  <li>Then you take all this evidence that you’ve gathered through hundreds of interviews and thousands of emails and present it to the EF Investment Committee. If they like your idea, you get £80k for a 10% stake in your company. You get to work on it more till you reach the maturity to pitch your company at demo day to dozens and dozens of great VCs with the intention of raising a seed round (~£1-2M) with one of them.</li>
  <li>If you get seed funded (usually 4-6 months after demo day) then hurray, your VC fuelled company building journey can finally begin. Unfortunately, the odds are still <a href="https://medium.com/journal-of-empirical-entrepreneurship/dissecting-startup-failure-by-stage-34bb70354a36">heavily stacked against you</a>:
    <ul>
      <li>There’s only about a 20% chance you’ll make it to the next funding round. Quite annoyingly, you’ll need several of those in the coming years to keep your unicorn alive - they are hungry beasts.</li>
      <li>There’s a 97% chance that you’ll fail to exit, i.e. fail to turn your years and years of gruelling work into hard earned millions.</li>
    </ul>
  </li>
</ul>

<p>Hm… That was depressing to learn, but don’t worry, it’ll get worse.</p>

<h3 id="the-up">The up</h3>

<p>As anyone who’s ever tried will tell you, building a company is like being on a rollercoaster ride. Sometimes you have days that feel like none of the days in your previous office jobs. You feel amazing, fulfilled and working on something truly meaningful (at least to you).</p>

<p>Even better, sometimes things just work out. Like when we started to ask huge and well-known US research hospitals if they would partner with us (two random unfunded guys from London) to build the world’s first federated machine learning platform for healthcare and they just said “yeah sure”.</p>

<p>Or when the second and third meetings started to occur with these teams, and the term “letter of intent” started to fly around a lot. We felt invincible. Even if it took more than a hundred Zoom calls and thousands of emails sent out, we thought we are clearly making progress with business development here.</p>

<h3 id="the-top">The top</h3>

<p>Then the rollercoaster continued and took us to this amazing top. Armed with our letters of intent and signed project proposals with these hospitals, EF’s IC said they’d invest in us and just like that, we got the pre-seed funding.</p>

<p>Roughly 30% of the initial EF cohort make it this far so we felt great. Even though we knew the work is just about to get a whole lot more challenging and crazy, there’s a moment when you have your first little success and you start quietly wondering to yourself:</p>

<blockquote>
  <p>Maybe we’ll be among the 1% of startups that actually make it… I know it’s  unlikely, but maybe this will all just work out fine!</p>
</blockquote>

<p>I was also super excited that I get to finally build again after months of not coding. Don’t get me wrong, conducting BD calls, writing marketing materials, technical documents, grants, drafting SOWs and LOIs was extremely educational too and they are necessary and unavoidable parts of every company formation. Nonetheless, I was itching to actually get back to the thing I love doing and I’m reasonably good at.</p>

<h3 id="the-down">The down</h3>

<p>After the pre-seed investment, I was 100% on building and my co-founder was 100% on business development. We only had 2.5 months till demo day to:</p>

<ul>
  <li>Build an MVP of the highly complex product we envisioned.</li>
  <li>Get extremely conservative and risk averse pharma companies and hospitals to sign up with our marketplace.</li>
</ul>

<p>Our plan seemed straightforward. I am going to take care of the first one and my co-founder is doing the second. Even though we knew the second is probably dependent on the first being ready, we agreed to work as hard as we can and try to have our first customers by demo day in late September 2019.</p>

<p>However, the cracks started to show quite early on… The business development process went from painfully hard (pre-IC) to near impossibly hard (post-IC). Many people told us that letters of intent are worth the same as toilet paper, and we should try to convert those into signed contracts for paid or unpaid trials ASAP, so that’s what we tried to do.</p>

<p>Despite my co-founder’s heroic efforts however, after months of negotiations, meetings, project proposals and more meetings with US hospitals, <strong>every single lead of ours simply dried up</strong>. Emails went unanswered. Crucial final meetings with the key stakeholders did not happen.</p>

<p>When the discussions turned real, and when hospitals realised that for this fancy-sounding research project they’d need to actually provision resources for us so we can integrate our software into their IT systems, they went cold turkey on us.</p>

<h3 id="the-small-up-before">The small up before..</h3>

<p>We realised that we made our own lives impossible by trying to aggressively innovate on two fronts at once:</p>

<ul>
  <li>We wanted to build a federated ML platform for deep learning models in a notoriously conservative industry, leveraging highly sensitive data with tons of regulations around it.</li>
  <li>We wanted to create a marketplace, therefore we had to find not just one customer type but two: providers and vendors too.</li>
</ul>

<p>Even just one of these goals would have been insanely hard for a two-person team to pull off in 6 months, but doing them together was clearly way too much. So we pivoted and said:</p>

<blockquote>
  <p>Let’s sell our federated ML platform to pharma companies. Let them use it with their existing hospital relationships however they see fit.</p>
</blockquote>

<p>This wasn’t the worst idea to be honest. Pharma companies already have longstanding relationships with hospitals and outpatient clinics, as these connections are essential for recruiting patients for new clinical trials.</p>

<p><strong>Healthcare</strong> - as we found out to our own detriment - <strong>is built on trust and slowly evolving long-term partnerships</strong>. There’s very little place for disruptive technologies, especially pushed by small companies. Due to the heavily regulated and risk averse nature of healthcare, you can have the best tech product and it’ll still be extremely hard to sell (this was confirmed to us by numerous companies on the market).</p>

<p>So we thought, let’s sell the technology to the innovation leads and heads of data science of large pharma companies. Then they will take care of getting the tech to the data, i.e. inside the hospitals.</p>

<h3 id="the-crash">The crash</h3>

<p>This hasn’t really changed the MVP I had to build, only the way we’d demo it to users potentially, so I proceeded further with full steam.</p>

<p>My co-founder in the meanwhile was trying to line up as many demo opportunities as he could, so we would have a good chance of converting at least one or two of those into an unpaid trial by demo day. Then we’d have our hard-won <em>“traction”</em> in our hands for our discussions with VCs.</p>

<p>I finished <a href="/federeated_learning_platform">the MVP</a> and we started to demo it to large pharma companies. Quite miraculously, none of them thought it was terrible. In fact, some of them even murmured something positive about it during the call.</p>

<p>But crucially, <strong>none of them jumped out of their chair singing Hail Mary</strong>, thanking us for finally solving their long standing hair-on-fire problem. Instead, they all said, they’ll get back to us after they had some internal discussions.</p>

<p>Although sales cycles in healthcare are notoriously long, and selling to pharma as a tiny startup is near impossible, we knew we missed the mark. We could simply feel after these calls that we aren’t solving any of these teams’ top 3 problems. What we offered was definitely in the top 10 or 15, but not even close to top 3.</p>

<p>And then, to make things worse (or better?)</p>

<blockquote>
  <p>through a series of honest chats with my co-founder, I found out that his heart isn’t really in federated learning anymore.</p>
</blockquote>

<p>Turns out, it’s a pretty big problem when the CEO of a company is not emotionally invested in and hyped up about the very thing the company is selling. It’s especially bad if this happens literally weeks before he’s supposed to stand in front of a hundred VCs and convince them that our business is the one that’s going to change the world and which is worth their £1M investment.</p>

<h3 id="operation-salvage">Operation Salvage</h3>

<p>I totally empathised with the frustration of my co-founder after he struggled for months to sell without much to show for it… However it felt rather bad to give up on the idea at the very last minute.</p>

<p>Granted, our traction was practically non-existent at that point, but I suspected from the beginning that selling this product will be incredible hard and might potentially take years. We also knew for a fact that selling our product isn’t impossible, as we have found <a href="https://trinetx.com/">companies that managed to get into US hospitals</a> and others that <a href="https://owkin.com/">worked successfully on something similar to our idea</a> (although both with incredible funding behind their backs). So personally I wasn’t disappointed, and I wasn’t that surprised with our lack of progress. But clearly my co-founder was and it was him who had to muster the energy day after day to try and sell this thing.</p>

<p>It was pretty clear to me that just like you cannot make someone love another human being, you cannot make someone feel passion for something for which they simply don’t. So reluctantly, I agreed to move on and use the rest of our pre-seed funding to build something else for the next demo day (which was scheduled for 6 months later).</p>

<p>We told our plans to EF (who were really nice and supportive about it), then proceeded to conduct one of the most painful 4 weeks of my life. We brainstormed in the Google Startup Campus, the British Library and countless pubs and cafes of London for days on end. We were desperately trying to come up with an idea which we both felt good about, meaning we would be willing to dedicate a couple years of our lives to it.</p>

<p>Whiteboard sessions came and went, beers and many more coffees were had. We tried for hours each day, but one of the two following scenarios kept happening:</p>

<ul>
  <li>Either founder A hated the idea founder B just pitched or,</li>
  <li>we both quickly realised that founder B’s idea was genuinely terrible, so we just laughed (or cried).</li>
</ul>

<h3 id="the-end">The end</h3>

<p>After weeks of this, I proposed to leave the company and sell my shares to my co-founder. Again, EF was incredibly nice about this and signed all the necessary contract modifications that allowed me a clean exit. Then, on a rainy October day, six months after joining EF,</p>

<blockquote>
  <p>my co-founder and I said goodbye in a typical London pub and that was the end of my first startup.</p>
</blockquote>

<p>As I walked towards the tube, lots of thoughts and feelings were rushing through my head… None of them particularly positive or pleasant, but I knew I made the right decision.</p>

<h2 id="takeaways">Takeaways</h2>

<p>I probably learned more about myself and the world in those six months than in the preceding 2.5 years in my typical 9 to 5 corporate data-science job. I couldn’t possibly summarise all of it here and some (or most) of it might be completely trivial to some readers. So here’s a list of my top learnings.</p>

<h3 id="what-did-i-learn">What did I learn?</h3>

<ul>
  <li><strong>Product market fit is (almost) everything</strong>. It’s a simple sounding but pretty complex idea. Here’s a <a href="https://a16z.com/2017/02/18/12-things-about-product-market-fit/">good intro</a> to it, and here’s the <a href="https://defmacro.substack.com/p/go-to-market-strategy-for-engineers">best step by step guide</a> I’ve found so far about how to achieve it.</li>
  <li><strong>Ideas are cheap.</strong> Execution is all that matters. It’s been repeated ad-nauseam in startup circles but I think it’s mostly true so worth noting. Although, some successful people <a href="https://www.indiehackers.com/podcast/170-vincent-woo-of-coderpad">challenge this</a> and advocate the exact opposite. The truth (as usual) is probably somewhere in the middle, but definitely closer to the “ideas are cheap” side.
    <ul>
      <li>Related tip: never be afraid to talk about your idea. It’s the only way to find funding and co-founders (and most likely you’ll need at least one of those).</li>
    </ul>
  </li>
  <li><strong>The tale of two ideas:</strong> imagine you have two ideas, X and Y. Let’s say, idea X solves a problem, which for a 100 people is so serious, they’d sell their kidneys (both in fact) to get it fixed. Idea Y solves a problem for a 10,000 people and they’d be willing to pay (they say) $20 for it. Which one you should pursue? Before EF, I would have chosen idea Y in a heartbeat. Today, I’d kill to have an idea that is like X. Always choose idea X.</li>
  <li><strong>Finding a great co-founder is exceptionally hard</strong>, although I definitely lucked out with mine on many fronts. In general, and contrary to popular startup wisdom, I’d prioritize the following qualities above charisma, genius-level IQ, qualifications or anything else:
    <ul>
      <li>integrity &amp; honesty</li>
      <li>intellectual rigour &amp; logical consistency</li>
      <li>good (<a href="https://basecamp.com/books/calm">but not crazy</a>) work ethic &amp; resilience &amp; patience</li>
      <li>sense of humour &amp; being able to laugh at oneself</li>
    </ul>
  </li>
  <li><strong>Creating a great team</strong> of first 10 employees is even harder than finding a co-founder (from what I heard) and it’s probably the most important thing any founder will do after securing funding, as it will most likely determine the culture of the entire company for many years to come.</li>
  <li><strong>Sales, marketing and UX are super important</strong>. Probably more so than your code (especially at the beginning).
    <ul>
      <li>Related tip: don’t be the dumb tech guy that builds it, expecting the users to just show up and start using and loving it.</li>
    </ul>
  </li>
  <li><a href="http://momtestbook.com/"><strong>Mom test</strong></a> <strong>everything</strong>.</li>
  <li>Being able to evaluate business ideas critically is a fundamental skill for founders. The good news, that it can be learned. Also, a <a href="https://www.defmacro.org/2019/03/26/startup-checklist.html">good checklist</a> helps.</li>
  <li>Spending time on finding out what is it that you’d work on even if you didn’t get paid for it, is an amazingly useful way of focusing your life and career.</li>
  <li>Some <strong>healthcare related takeaways</strong> I wish I knew before starting:
    <ul>
      <li>Healthcare is conservative, built on trust and slowly evolving but longstanding relationships and partnerships.</li>
      <li>As a not surprising consequence of this, the average age of founders of unicorn healthcare startups is <a href="https://medium.com/@alitamaseb/land-of-the-super-founders-a-data-driven-approach-to-uncover-the-secrets-of-billion-dollar-a69ebe3f0f45">significantly higher</a> than of tech unicorns.</li>
      <li>Also, healthcare seems to be the only industry where having a PhD and many years of relevant experience is a prerequisite of being successful. In most other industries a BSc and/or an MBA seems to be enough.</li>
      <li>If you are planning to build and sell any tech related product in healthcare, be prepared for extremely long sales cycles, business partners who proceed with extreme caution and who care a lot about the optics of your company.</li>
      <li>Therefore, all in all, healthcare is not best suited for tiny startups, created by starry eyed 20-30 something founders with tiny professional networks and little work experience in the field.</li>
    </ul>
  </li>
</ul>

<h3 id="what-do-i-miss">What do I miss?</h3>

<p>Being a founder of your own deep tech company feels amazing on most days. Here are some of the things I miss:</p>

<ul>
  <li>The autonomy, responsibility and fast pace is infectious and invigorating. Especially coming from a traditional healthcare behemoth like IQVIA.</li>
  <li>Living in a “Come on, we can do this!” mindset and being surrounded by people who think that way.</li>
  <li>Being surrounded by motivated, ambitious, highly educated and driven people who chose to veer off the traditional corporate track is amazing. Again, in my opinion this is definitely the USP of EF.</li>
  <li>Being able to determine the work schedule and culture of your team.</li>
  <li>Being able to just spend a whole day on learning about something, because that’s what the business calls for.</li>
  <li>Talking to other founders and potential customers teaches you that the world is so much more complex, interesting and nuanced than it seems as an employee in a small vertical of a single industry. There are hundreds of industries, all with their own inefficiencies, suboptimal solutions, knowledge gaps, tech hurdles. Learning about these is fascinating and broadens you as a person and as a professional.</li>
</ul>

<h3 id="will-i-do-it-again">Will I do it again?</h3>

<p><strong>Absolutely!</strong> Although I might take a different funding route.</p>

<p>But that’s a topic for another post…</p>]]></content><author><name>danielhomola</name></author><category term="startups" /><category term="learning" /><category term="deep learning" /><category term="federated learning" /><summary type="html"><![CDATA[The story of our healthcare AI startup and how I didn't become a millionaire]]></summary></entry><entry><title type="html">Science Flask is released</title><link href="https://danielhomola.com/phd/science-flask-is-released/" rel="alternate" type="text/html" title="Science Flask is released" /><published>2017-04-30T22:16:00+02:00</published><updated>2017-04-30T22:16:00+02:00</updated><id>https://danielhomola.com/phd/science-flask-is-released</id><content type="html" xml:base="https://danielhomola.com/phd/science-flask-is-released/"><![CDATA[<h2 id="why-use-scienceflask">Why use ScienceFlask?</h2>

<p>Building <a href="/corrmapper">CorrMapper</a> was one of the hardest things I’ve ever done. I had no idea how many pieces I will need to fit together to turn my my bioinformatics pipeline into a functioning web-app.</p>

<p>I learned a lot from it, and I wanted to save the pain and the steep learning curve for my fellow scientist colleagues, who might not want to spend a full week of their life on trying to get an upload form to work properly. Yeah.. those were fun times..</p>

<p>Here’s the simple idea behind Science Flask:</p>

<p><a href="/assets/images/science_flask_pipeline.png"><img src="/assets/images/science_flask_pipeline.png" alt="Science Flask flowchart" /></a></p>

<p>Notice how everything in blue is non-specific to any scientific app. So then why are we keep re-developing it? Ideally, scientists need not to work on anything else than the green bit. Then they can plug that into Science Flask with a few hours of work and have their tool online in a day or two, instead of weeks.</p>

<p>Here’s the <a href="https://github.com/danielhomola/science_flask">GitHub repo</a> with some <a href="https://github.com/danielhomola/science_flask/blob/master/README.md">lengthy docs</a> about the structure of the project. I also wrote a <a href="https://github.com/danielhomola/science_flask/blob/master/deployment.md">step-by-step guide to deploy your Science Flask app on an AWS</a>.</p>

<h2 id="features">Features</h2>

<p>Science Flask comes batteries included.</p>
<h3 id="user-management">User management</h3>

<p>User’s are only allowed to register with a valid academic email address. This is to ensure that your tool is mainly used for academic and research purposes and not for commercial uses. Furthermore it comes with all the rest of it: email addresses are confirmed, users can change passwords, get password reset request if they forgot it, etc.</p>

<p>Thanks Flask-Security, you can also assign roles to different users and easily build custom user management logic. For example you might decide that certain users can only use a part of the application, while other users can access all features.</p>

<h3 id="sql-database">SQL database</h3>

<p>All user, study and analysis data is stored in an SQLite by defaul. This can be changed to MySQL or Postgre SQL easily and the same code will work, thanks to <code>SQLAlchemy</code>. Thanks to Flask-Migrate if you change your app’s model, you can easily upgrade your database even when your app is deployed.</p>

<h3 id="admin-panel">Admin panel</h3>

<p>The model (database tables and relations between them) of your app can be easily edited online, from anywhere using CRUD operations. Thanks to Flask-Admin, setting up an admin user who can edit users, and other databases is as simple as modifying 2 lines in the config file.</p>

<h3 id="upload-form">Upload form</h3>

<p>Getting the data from the user sounds super simple but you’d be surprised how long does it take to get a decent upload page. Also it’s very easy to build complex form logic from the bricks Science- Flask provides.</p>

<h3 id="profile-page">Profile page</h3>

<p>This collects the uploaded studies of each user and let’s them submit analysis on their data.</p>

<h3 id="analysis-form">Analysis form</h3>

<p>Just like with the upload form, you can build custom logic to ensure you get the parameters from the user just right. The analysis job is then submitted to the backend. This uses <code>Celery</code>. Once the analysis is ready, the user is notified in email. Then they can download or check out their results online.</p>

<h3 id="logging">Logging</h3>

<p>All errors and warning messages are sent to the admins via email. All analysis exceptions and errors could be catched so that the program crashes gracefully, letting the user know what happened.</p>

<h3 id="runs-on-bootstrapcss">Runs on Bootstrap.css</h3>

<p>Modern, mobile friendly, responsive. Bootstrap makes writing good looking HTML pages dead easy.</p>

<h3 id="tool-tips-and-tours">Tool tips and tours</h3>

<p>Explain to the user how your application works with interactive tours (available on all the above listed pages) and tooltips.</p>

<h3 id="python3">Python3</h3>

<p>The whole project is written in Python3.5 (because it’s 2017).</p>

<h2 id="feedback">Feedback</h2>

<p>I hope it’ll be useful for someone. I definitely would have loved something like this when I started develop CorrMapper. Also if you have an idea to improve it, then please contribute to the project!</p>]]></content><author><name>danielhomola</name></author><category term="phd" /><category term="flask" /><category term="python" /><category term="science-flask" /><summary type="html"><![CDATA[An extensible modular web-app template for online scientific research tools]]></summary></entry><entry><title type="html">CorrMapper is finished</title><link href="https://danielhomola.com/phd/machine%20learning/corrmapper-is-finished/" rel="alternate" type="text/html" title="CorrMapper is finished" /><published>2017-04-30T00:00:00+02:00</published><updated>2017-04-30T00:00:00+02:00</updated><id>https://danielhomola.com/phd/machine%20learning/corrmapper-is-finished</id><content type="html" xml:base="https://danielhomola.com/phd/machine%20learning/corrmapper-is-finished/"><![CDATA[<h2 id="overview">Overview</h2>

<p>CorrMapper was the main project of my <a href="/assets/DanielHomola_PhD.pdf">PhD</a>. It is an online research tool for the integration and visualisation of complex biomedical and omics datasets.</p>

<!-- Courtesy of embedresponsively.com //-->

<div class="responsive-video-container">
    <iframe src="https://www.youtube-nocookie.com/embed/ZNwc5aCFonI" frameborder="0" webkitallowfullscreen="" mozallowfullscreen="" allowfullscreen=""></iframe>
  </div>

<h2 id="why-corrmapper-is-needed">Why CorrMapper is needed?</h2>

<p>CorrMapper could be best understood by thinking of the problems researchers with complex biomedical datasets face these days.</p>

<h3 id="analytical-platforms-are-getting-a-lot-cheaper">Analytical platforms are getting a lot cheaper</h3>

<p>Most of the <strong>analytical platforms</strong> we use today in life sciences and medical research <strong>are getting cheaper each year</strong>. Some of them are getting cheaper at a ridiculous rate. </p>

<p>The sequencing and assembly of the first human genomes cost hundreds of millions of dollars ($3 billion by the US government funded project 1 and $300,000,000 by the private Celera initiative) and took 11 and 3 years respectively.</p>

<p>Yet today, less than 15 years later, we are about to pass the $1000 price point in human genome sequencing, with the Illumina HiSeq X Ten, which will be capable of sequencing 18,000 human genomes per year, to the gold standard of 30× coverage.</p>

<h3 id="rise-of-multi-omics-studies">Rise of multi-omics studies</h3>

<p>Usually, when products get cheaper two things happen:</p>
<ul>
  <li>more people start using them,</li>
  <li>people use more of them. </li>
</ul>

<p>If this happens to several analytical platform simultaneously, then researchers with the same budget will suddenly be able to design studies which utilise multiple platforms at once. This is precisely what happened in the past 10 years in life sciences and <strong><em>multi-omics</em> studies are becoming a lot more popular and affordable</strong>.</p>

<p>Multi-omics just means that we have more than one omics dataset, where omics is the terminology used in life sciences to collectively refer to the data coming from genomics, transcriptomics, metagenomics, metabolomics, etc.</p>

<p>Multi-omics studies have great potential as they allow us to examine the biology behind a disease from multiple viewpoints, each analytical platform opening a new window to the underlying biochemical processes.  </p>

<p>For example the change of gene expression in colon cancer is just as important as the changes in epigenomic markers, or the gut microbiome which cannot be ignored neither, as there seems to be a complex, multi-level interplay between the bugs in our gut and our health.</p>

<h3 id="multi-omics-studies-have-too-many-features">Multi-omics studies have too many features</h3>

<p>How do we relate these disparate datasets and combine them so that their complimentary information could be harnessed to expand our biomedical knowledge?</p>

<p><strong>Modern omics datasets are extremely feature rich</strong> and in multi-omics studies this complexity is compounded by a second or even third dataset. Many of these features however, might be completely irrelevant to the studied biological problem, or redundant in the context of others (multicollinearity). We wouldn’t expect for example to find all 25000 human genes to be involved in breast cancer, or all urinary metabolites as candidate biomarkers for liver failure.</p>

<h3 id="multi-omics-studies-are-hard-to-visualise">Multi-omics studies are hard to visualise</h3>

<p>Learning from such feature rich datasets inevitably incurs an increased <strong>computational cost</strong>. It also increases the chance of <strong>over- fitting the noise</strong> in our data, while reducing the predictive power of our models. Finally, the correlation networks arising from these high-throughput datasets are often hard to interpret and explore due to their density and lack of interactive tools.</p>

<h3 id="clinical-metadata-presents-additional-complexity">Clinical metadata presents additional complexity</h3>

<p>Finally, biomedical studies will have <strong>increasing amounts of metadata</strong> attached to the actual omics measurements, making the stratification of patients easier than ever before. This is largely due to the explosion of digital/wearable health gadgets and the radical improvement in the digitization of healthcare records.</p>

<h2 id="how-does-corrmapper-work">How does CorrMapper work?</h2>

<p>CorrMapper attempts the near impossible and address several of these problems at once.</p>

<h3 id="corrmappers-pipeline">CorrMapper’s pipeline</h3>

<p><a href="/assets/images/corrmapper_pipeline.png"><img src="/assets/images/corrmapper_pipeline.png" /></a></p>

<h3 id="interactive-metadata-explorer">Interactive metadata explorer</h3>

<p>CorrMapper provides a<strong> completely automatically generated metadata explorer</strong> which allows researchers to explore and stratify their patient cohort with an <strong>interactive dashboard</strong> which seamlessly integrates metadata with up to two omics datasets.</p>

<h3 id="advanced-feature-selection">Advanced feature selection</h3>

<p>Several <strong>cutting edge feature selection algorithms</strong> have been built into CorrMapper to allow researchers to focus their attention to only those features which have the most discriminatory power with respect to a metadata variable, for example cancer vs. control. This not only decreases the computational cost of subsequent analysis steps but also<strong> helps with the interpretation of the data</strong>.</p>

<h3 id="estimation-of-sparse-covariance-structures">Estimation of sparse covariance structures</h3>

<p>The selected features are then used to estimate a sparse inverse covariance matrix using the graphical lasso algorithm. This is useful because under Gaussian assumptions this inverse covarience matrix will only be zero if the row and column variables of the given cell are conditionally independent given all other features in the matrix.</p>

<p>In plain English, we can work out which variables are <strong>conditionally independent</strong> (having removed all the confounding effects of the others). This is hugely important because without this, the complexity of biological systems would almost certainly guarantee that we will see a lot of spurious and confounded correlations in our analysis. Based on the inverse covariance matrix we can draw a <strong>network of correlated variables</strong>, see below.</p>

<h3 id="robust-estimation-of-statistical-significance">Robust estimation of statistical significance</h3>

<p>The <strong>edges of the network represent Spearman rank correlations</strong> for which p values are estimated using 10000 permutations. The <em>p-values</em> are made more precise using a Generalized Pareto Distribution based method. Finally the p values are corrected for multiple testing using one of the user selected methods.</p>

<h3 id="highly-interactive-visualisation-of-correlation-networks">Highly interactive visualisation of correlation networks</h3>

<p>The resulting <strong>heatmap and networks of correlations</strong> are then simultaneously visualised and <strong>interlinked</strong>.</p>

<p>If the uploaded datasets have genomic features, this allows CorrMapper to use a more appropriate <strong>genomic network visualisation</strong>, where the features are laid out in clockwise fashion along the genome of the given species.</p>]]></content><author><name>danielhomola</name></author><category term="phd" /><category term="machine learning" /><category term="python" /><category term="feature selection" /><category term="data integration" /><category term="data visualisation" /><summary type="html"><![CDATA[A biomedical data integration and visualisation platform leveraging advanced feature selection and covariance estimation techniques.]]></summary></entry><entry><title type="html">Newton’s method with 10 lines of Python</title><link href="https://danielhomola.com/learning/newtons-method-with-10-lines-of-python/" rel="alternate" type="text/html" title="Newton’s method with 10 lines of Python" /><published>2016-02-09T14:51:00+01:00</published><updated>2016-02-09T14:51:00+01:00</updated><id>https://danielhomola.com/learning/newtons-method-with-10-lines-of-python</id><content type="html" xml:base="https://danielhomola.com/learning/newtons-method-with-10-lines-of-python/"><![CDATA[<h2 id="problem-setting">Problem setting</h2>
<p style="text-align: justify;">Newton's method, which is an old numerical approximation technique that could be used to find the roots of complex polynomials and any differentiable function. We'll code it up in 10 lines of Python in this post.</p>
<p style="text-align: justify;">Let's say we have a complicated polynomial:</p>
<p style="text-align: center;">$latex f(x)=6x^5-5x^4-4x^3+3x^2 $</p>
<p style="text-align: justify;">and we want to find its roots. Unfortunately we know from the <a href="https://www.wikiwand.com/en/Galois_theory">Galois theory</a> that there is no formula for a 5th degree polynomial so we'll have to use numeric methods. Wait a second. What's going on? We all learned the quadratic formula in school, and there are formulas for cubic and quartic polynomials, but Galois proved that no such "root-finding" formula exist for fifth or higher degree polynomials, that uses only the usual algebraic operations (addition, subtraction, multiplication, division) and application of radicals (square roots, cube roots, etc).</p>

<h3 id="bit-more-maths-context">Bit more maths context</h3>
<p style="text-align: justify;">Some <a href="https://www.reddit.com/user/pqnelson">nice</a> <a href="https://www.reddit.com/user/KalROFL">guys</a> pointed out on reddit that I didn't quite get the theory right. Sorry about that, I'm no mathematician by any means. It turns out that this polynomial could be factored into $latex x^2(x-1)(6x^2 + x - 3)$ and solved with traditional cubic formula.</p>
<p>Also the theorem I referred to is the <a href="https://en.wikipedia.org/wiki/Abel%E2%80%93Ruffini_theorem">Abel-Ruffini Theorem</a> and it only applies to the solution to the general polynomial of degree five or greater. Nonetheless the example is still valid, and demonstrates how would you apply Newton's method, to any polynomial, so let's crack on.</p>

<h3 id="simplest-way-to-solve-it">Simplest way to solve it</h3>
<p style="text-align: justify;">So in these cases we have to resort to numeric linear approximation. A simple way would be to use the <a href="https://www.wikiwand.com/en/Intermediate_value_theorem">intermediate value theorem</a>, which states that if $latex f(x)$ is continuous on $latex [a,b]$ and $latex f(a) &lt; y&lt; f(b)$, then there is an $latex x$ between $latex a$ and $latex b$ so that $latex f(x)=y$.</p>
<p style="text-align: justify;">We could exploit this by looking for an $latex x_1$ where $latex f(x_1)&gt;0$ and an $latex x_2$ where $latex f(x_2)&lt;0$, and then we could be certain that $latex f(x)=0$ must be between $latex x_1$ and $latex x_2$. So we could  check $latex x_3=\frac{x_2-x_1}{2}$, and find that $latex f(x_3)$ will be positive, then continue with$latex x_4=\frac{x_2-x_3}{2}$ which would be negative and our proposed $latex x_n$ would become closer and closer to $latex f(x_n)=0$. This method however can be pretty slow, so Newton devised a better way to speed things up (when it works).</p>

<h3 id="how-newton-solved-it">How Newton solved it</h3>
<p style="text-align: justify;">If you look at the figure below, you'll see the plot of our polynomial. It has three roots at 0, 1, and somewhere in-between. So how do we find these?</p>
<p style="text-align: justify;">In Newton's method we take a random point $latex f(x_0)$, then draw a tangent line through $latex x_0, f(x_0)$, using the derivative $latex f'(x_0)$. The point $latex x_1$ where this tangent line crosses the $latex x$ axis will become the next proposal we check. We calculate the tangent line at $latex f'(x_1)$ and find $latex x_2$. We carry on, and as we do $latex |f(x_n)| \to 0$, or in other words we can make our approximation as close to zero as we want, provided we are willing to continue with the number crunching. Using the fact that the slope of tangent (by the definition of derivatives) at $latex x_n$ is $latex f'(x_n)$ we can derive the formula for $latex x_{n+1}$, i.e. where the tangent crosses the $latex x$ axis:</p>
<p style="text-align: center;">$latex x_{n+1}=x_n-\frac{f(x_n)}{f'(x_n)}$</p>
<p><img src="/assets/images/newton_polynomial.png" alt="Newton's method" /></p>

<h2 id="code">Code</h2>
<p style="text-align: justify;">With all this in mind it's easy to write an algorithm that approximates $f(x)=0$ with arbitrary error $latex \varepsilon$. Obviously in this example depending on where we start $latex x_0$ we might find different roots.</p>

<figure class="highlight"><pre><code class="language-python" data-lang="python"><table class="rouge-table"><tbody><tr><td class="gutter gl"><pre class="lineno">1
2
3
4
5
6
7
8
9
10
</pre></td><td class="code"><pre><span class="k">def</span> <span class="nf">dx</span><span class="p">(</span><span class="n">f</span><span class="p">,</span> <span class="n">x</span><span class="p">):</span>
    <span class="k">return</span> <span class="nb">abs</span><span class="p">(</span><span class="mi">0</span><span class="o">-</span><span class="n">f</span><span class="p">(</span><span class="n">x</span><span class="p">))</span>

<span class="k">def</span> <span class="nf">newtons_method</span><span class="p">(</span><span class="n">f</span><span class="p">,</span> <span class="n">df</span><span class="p">,</span> <span class="n">x0</span><span class="p">,</span> <span class="n">e</span><span class="p">):</span>
    <span class="n">delta</span> <span class="o">=</span> <span class="n">dx</span><span class="p">(</span><span class="n">f</span><span class="p">,</span> <span class="n">x0</span><span class="p">)</span>
    <span class="k">while</span> <span class="n">delta</span> <span class="o">&amp;</span><span class="n">gt</span><span class="p">;</span> <span class="n">e</span><span class="p">:</span>
        <span class="n">x0</span> <span class="o">=</span> <span class="n">x0</span> <span class="o">-</span> <span class="n">f</span><span class="p">(</span><span class="n">x0</span><span class="p">)</span><span class="o">/</span><span class="n">df</span><span class="p">(</span><span class="n">x0</span><span class="p">)</span>
        <span class="n">delta</span> <span class="o">=</span> <span class="n">dx</span><span class="p">(</span><span class="n">f</span><span class="p">,</span> <span class="n">x0</span><span class="p">)</span>
    <span class="k">print</span> <span class="s">'Root is at: '</span><span class="p">,</span> <span class="n">x0</span>
    <span class="k">print</span> <span class="s">'f(x) at root is: '</span><span class="p">,</span> <span class="n">f</span><span class="p">(</span><span class="n">x0</span><span class="p">)</span>
</pre></td></tr></tbody></table></code></pre></figure>

<p>There you go, we’are done in 10 lines (9 without the blank line), even less without the print statements.</p>

<h3 id="in-use">In use</h3>

<p style="text-align: justify;">So in order to use this, we need two functions, $latex f(x)$ and $latex f'(x)$. For this polynomial these are:</p>

<figure class="highlight"><pre><code class="language-python" data-lang="python"><table class="rouge-table"><tbody><tr><td class="gutter gl"><pre class="lineno">1
2
3
4
5
</pre></td><td class="code"><pre><span class="k">def</span> <span class="nf">f</span><span class="p">(</span><span class="n">x</span><span class="p">):</span>
    <span class="k">return</span> <span class="mi">6</span><span class="o">*</span><span class="n">x</span><span class="o">**</span><span class="mi">5</span><span class="o">-</span><span class="mi">5</span><span class="o">*</span><span class="n">x</span><span class="o">**</span><span class="mi">4</span><span class="o">-</span><span class="mi">4</span><span class="o">*</span><span class="n">x</span><span class="o">**</span><span class="mi">3</span><span class="o">+</span><span class="mi">3</span><span class="o">*</span><span class="n">x</span><span class="o">**</span><span class="mi">2</span>

<span class="k">def</span> <span class="nf">df</span><span class="p">(</span><span class="n">x</span><span class="p">):</span>
    <span class="k">return</span> <span class="mi">30</span><span class="o">*</span><span class="n">x</span><span class="o">**</span><span class="mi">4</span><span class="o">-</span><span class="mi">20</span><span class="o">*</span><span class="n">x</span><span class="o">**</span><span class="mi">3</span><span class="o">-</span><span class="mi">12</span><span class="o">*</span><span class="n">x</span><span class="o">**</span><span class="mi">2</span><span class="o">+</span><span class="mi">6</span><span class="o">*</span><span class="n">x</span>
</pre></td></tr></tbody></table></code></pre></figure>

<p style="text-align: justify;">Now we can simply find the three roots with:</p>

<figure class="highlight"><pre><code class="language-python" data-lang="python"><table class="rouge-table"><tbody><tr><td class="gutter gl"><pre class="lineno">1
2
3
4
5
6
7
8
9
10
</pre></td><td class="code"><pre><span class="n">x0s</span> <span class="o">=</span> <span class="p">[</span><span class="mi">0</span><span class="p">,</span> <span class="p">.</span><span class="mi">5</span><span class="p">,</span> <span class="mi">1</span><span class="p">]</span>
<span class="k">for</span> <span class="n">x0</span> <span class="ow">in</span> <span class="n">x0s</span><span class="p">:</span>
    <span class="n">newtons_method</span><span class="p">(</span><span class="n">f</span><span class="p">,</span> <span class="n">df</span><span class="p">,</span> <span class="n">x0</span><span class="p">,</span> <span class="mf">1e-5</span><span class="p">)</span>

<span class="c1"># Root is at:  0
# f(x) at root is:  0
# Root is at:  0.628668078167
# f(x) at root is:  -1.37853879978e-06
# Root is at:  1
# f(x) at root is:  0</span>
</pre></td></tr></tbody></table></code></pre></figure>

<h1 id="summary">Summary</h1>
<p>All of the above code, and some additional comparison test with the <code class="language-plaintext highlighter-rouge">scipy.optimize.newton</code> method can be found in this <a href="https://gist.github.com/danielhomola/de1726bfc7330b2c9b2a">Gist</a>. And don’t forget, if you find it too much trouble differentiating your functions, just use <a href="http://live.sympy.org/">SymPy</a>, I wrote about it <a href="http://danielhomola.com/2016/02/06/solving-real-world-problems-with-sympy/">here</a>.</p>

<p>Newton’s method is pretty powerful but there could be problems with the speed of convergence, and awfully wrong initial guesses might make it not even converge ever, see <a href="https://www.wikiwand.com/en/Newton's_method#/Practical_considerations">here</a>. Nonetheless I hope you found this relatively useful.. Let me know in the comments.</p>]]></content><author><name>danielhomola</name></author><category term="learning" /><category term="newton&apos;s method" /><category term="python" /><category term="optimization" /><summary type="html"><![CDATA[One of the oldest tricks in the book of numerical optimization]]></summary></entry><entry><title type="html">Solving “real world” problems with SymPy</title><link href="https://danielhomola.com/learning/solving-real-world-problems-with-sympy/" rel="alternate" type="text/html" title="Solving “real world” problems with SymPy" /><published>2016-02-06T18:51:00+01:00</published><updated>2016-02-06T18:51:00+01:00</updated><id>https://danielhomola.com/learning/solving-real-world-problems-with-sympy</id><content type="html" xml:base="https://danielhomola.com/learning/solving-real-world-problems-with-sympy/"><![CDATA[<h2 id="background">Background</h2>
<p><a href="http://www.sympy.org/en/index.html">SymPy</a> is an amazing library for symbolic mathematics in Python. It’s like <a href="http://www.wolfram.com/mathematica/">Mathematica</a>, and its <a href="http://live.sympy.org/">online shell</a> version along with <a href="http://www.sympygamma.com/">SymPy Gamma</a>  is pretty much like<a href="https://www.wolframalpha.com/"> Wolfram Alpha</a> (WA).</p>

<h3 id="problem-setting">Problem setting</h3>
<p>In this dummy example we’ll go to an imaginary gallery and figure out how far we should stand from a huge painting on the wall so we have the widest possible viewing angle.</p>

<p>If you have a look at the image below you’ll see, that the bottom of the painting is 3 meters above our level of eyesight and the top of the painting is 15 meters above it. You can imagine that if you were standing right below the painting you wouldn’t see much of it. Same thing would happen if you stood very far away. But where exactly should you stand to get the best viewing angle? I took this example from <a href="https://mooculus.osu.edu/">here</a>.</p>

<p><a href="/assets/images/sympy.jpg"><img src="/assets/images/sympy.jpg" /></a></p>

<h2 id="solution">Solution</h2>
<p>So we are looking for the maximum $latex \theta$ as we are moving closer to or further away from the painting, effectively varying $latex x$. Basic geometry tells us that we can find this angle as the difference of two related angles $latex \alpha-\beta$, and trigonometry tells us that</p>

<p class="text-center">$latex f(x) = \theta = \arctan \left(\frac{15}{x}\right)-\arctan \left(\frac{3}{x}\right) $.</p>

<h3 id="on-paper">On paper</h3>
<p>We want to find the maximum of this function with respect to $latex x$. We need to differentiate it, find its critical points and check at which of those critical points the second derivative is negative (i.e. there we’ll have the max of $latex f(x)$. We could do this manually remembering that</p>

<p class="text-center">$latex \frac{d}{dx}\arctan x=\frac{1}{1+x^2},$</p>

<p>but what’s the fun in that? :) </p>

<h3 id="using-sympy">Using SymPy</h3>
<p>So let’s type a few lines of code into <a href="http://live.sympy.org/">SymPy’s online shell</a>:</p>

<figure class="highlight"><pre><code class="language-python" data-lang="python"><table class="rouge-table"><tbody><tr><td class="gutter gl"><pre class="lineno">1
2
3
4
5
6
7
</pre></td><td class="code"><pre><span class="n">f</span> <span class="o">=</span> <span class="n">atan</span><span class="p">(</span><span class="mi">15</span><span class="o">/</span><span class="n">x</span><span class="p">)</span> <span class="o">-</span> <span class="n">atan</span><span class="p">(</span><span class="mi">3</span><span class="o">/</span><span class="n">x</span><span class="p">)</span>
<span class="n">df1</span> <span class="o">=</span> <span class="n">diff</span><span class="p">(</span><span class="n">f</span><span class="p">)</span>
<span class="n">df2</span> <span class="o">=</span> <span class="n">diff</span><span class="p">(</span><span class="n">diff</span><span class="p">(</span><span class="n">f</span><span class="p">))</span>
<span class="n">critical</span> <span class="o">=</span> <span class="n">solve</span><span class="p">(</span><span class="n">Eq</span><span class="p">(</span><span class="n">df1</span><span class="p">,</span> <span class="mi">0</span><span class="p">))</span>
<span class="n">critical</span>
<span class="n">df2</span><span class="p">.</span><span class="n">subs</span><span class="p">(</span><span class="n">x</span><span class="p">,</span> <span class="n">critical</span><span class="p">[</span><span class="mi">1</span><span class="p">])</span>
<span class="n">N</span><span class="p">(</span><span class="n">critical</span><span class="p">[</span><span class="mi">1</span><span class="p">])</span>
</pre></td></tr></tbody></table></code></pre></figure>

<h3 id="breaking-it-down">Breaking it down</h3>

<ol>
  <li>In the first line we define $latex f(x)$.
    <ul>
      <li>The cool thing here is that this is done symbolically, as we would do it on a piece of paper.  </li>
    </ul>
  </li>
  <li>In the 2nd line we differentiate this function.
    <ul>
      <li>This is done as it would be done on paper. If you now type $latex df$, you’ll get the derivative:</li>
      <li>$latex f’(x) = -\frac{15}{x^2 \left( 1+\frac{255}{x^2}\right)}+\frac{3}{x^2 \left( 1+\frac{9}{x^2}\right)}$</li>
      <li>Even if I had looked up $latex \frac{d}{dx} \text{arctan}(x)$, it would have taken a bit of time for me to get here to be honest..</li>
    </ul>
  </li>
  <li>In the third line we get the second derivative,</li>
  <li>In the 4th we find the critical points of $latex f(x)$.
    <ul>
      <li>Again everything is symbolic, nothing would make sense in pure Python, but it works beautifully in SymPy.</li>
    </ul>
  </li>
  <li>In the 5th line we print the critical points.
    <ul>
      <li>We get $latex -3\sqrt{5}$ and $latex 3\sqrt{5}$.</li>
      <li>Remember, we are looking for $latex x$, which is a distance, so we should be suspicious(to say the least) about the negative value, but we still need to check that $latex f(x)$ actually has a local maximum at $latex 3\sqrt{5}$.</li>
    </ul>
  </li>
  <li>That’s exactly what the 6th line does.
    <ul>
      <li>We substitute in the second critical point into the second derivative, and indeed we get a negative value, confirming that $latex f(x)$ has a local maximum at $latex 3\sqrt{5}$.</li>
    </ul>
  </li>
  <li>In the 7th line we use the $latex N()$ function to print out the numerical value of this expression, which is $latex \approx$ 6.7 meters.</li>
</ol>

<h2 id="summary">Summary</h2>
<p>So we should stand about 6.7 meters away from the painting to get the maximum possible viewing angle.</p>

<p>There you go, in less than 10 lines we did some optimization symbolically in Python. Actually we could have done this in about three lines, sacrificing a bit of clarity, but that’s never a good trade-off..</p>

<p>As I said, this is barely scratching the surface of what SymPy can do for you, but if you were after an alternative of Wolfram Alpha for symbolic mathematics, I think you’ll find it extremely helpful.</p>]]></content><author><name>danielhomola</name></author><category term="learning" /><category term="optimization" /><category term="python" /><category term="sympy" /><summary type="html"><![CDATA[Using symbolic maths in Python.]]></summary></entry></feed>